Cardano price struggles below $0.65 as bearish trend threatens key support
 ADA trades near critical support
Cardano (ADA) is facing mounting technical headwinds as the token continues to trade near $0.648, locked in a downtrend since its February high. The 4-hour and daily charts paint a bearish-to-neutral picture, with price action firmly below the Ichimoku Cloud and all key exponential moving averages.
ADA’s failure to reclaim even the 20 EMA at $0.658 underlines the weakness of recent recovery attempts, while the 200 EMA at $0.723 remains a distant hurdle. The 0.618 Fibonacci retracement level at $0.6768 is now a critical pivot on the weekly timeframe.
The $0.60–$0.63 support region has held multiple times, but repeated testing suggests weakening demand. If this floor breaks, Cardano could swiftly decline toward the $0.50 zone, where the 0.786 Fibonacci level aligns with a historical accumulation range from 2023. Conversely, overhead resistance at $0.70–$0.73 remains a barrier to any bullish reversal and coincides with a previously broken demand zone and trendline.
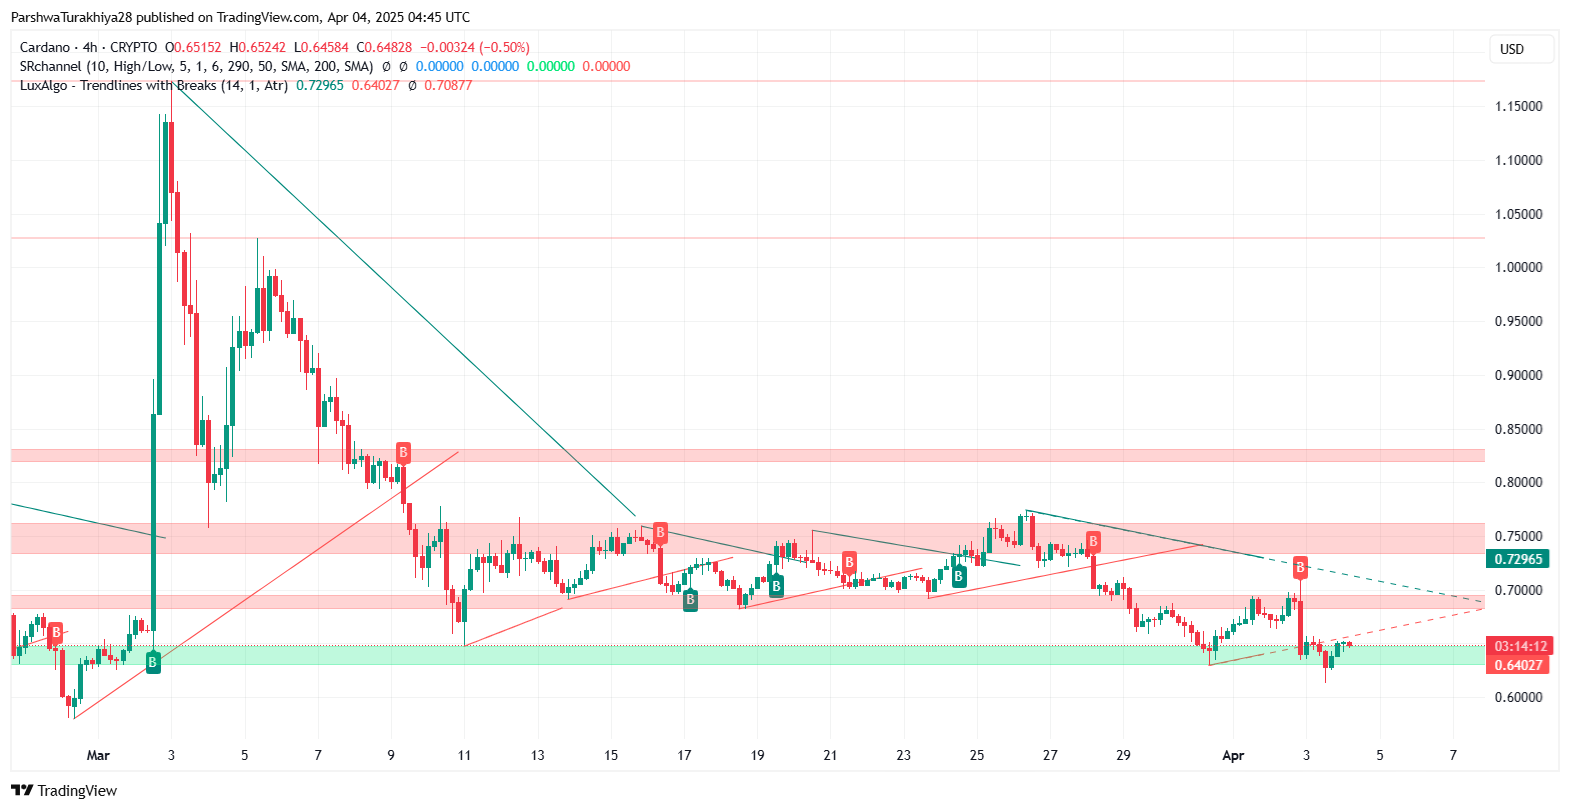
Cardano price dynamics (March 2025 - April 2025) Source: TradingView.
Technical indicators reflect indecision with a bearish tilt
The MACD is attempting a shallow crossover on the 4-hour chart but remains in negative territory, while the RSI lingers below 50 at 44.18—both indicators suggesting a lack of conviction among bulls. The stochastic oscillator echoes this stance, showing a mild rebound from oversold conditions but lacking strong upward signals. The Ichimoku system reinforces the bearish view, with price action under the Kumo cloud and a red, flat future cloud reflecting trend stagnation.
Bollinger Bands are compressed and hugging the lower edge near $0.626, signaling a potential volatility expansion. However, without a decisive breakout above the middle band at $0.663, downside risk prevails.
Outlook hinges on reclaiming resistance or holding $0.60
ADA’s path forward will largely depend on whether bulls can reclaim and flip the $0.675–$0.695 resistance zone into support. Until then, traders will closely watch the $0.60 level, as a breakdown could trigger a deeper decline toward $0.50. Momentum and volume need to align with any upward move to confirm a trend shift. In the absence of such signals, Cardano remains vulnerable to continued selloffs.
In our earlier analysis of ADA, we highlighted the significance of the $0.65–$0.66 zone as a demand region. The current setup confirms the weakening of this zone and validates the ongoing pressure below major EMAs, suggesting a wait-and-watch approach remains prudent.


