Chainlink price eyes recovery after defending key support, but bearish risks linger below $13
 Chainlink attempts breakout after holding key support at $10.50
Chainlink (LINK) is staging a cautious recovery after defending the critical $10.40–$10.50 support zone, signaling potential for a short-term rebound. The level aligns with the 1.0 Fibonacci retracement from the recent swing high, where strong historical demand has repeatedly stabilized price action.
Despite prevailing bearish pressure, a descending wedge breakout pattern is taking shape on the 4-hour chart, with price attempting to break above prior trendline resistance at $11.60.Momentum indicators are gradually improving. The RSI has recovered to 42.17, suggesting waning selling pressure, while the Stochastic RSI shows a bullish crossover near 67, indicating potential for upward continuation if volume supports. However, the MACD histogram remains faint, and although a bullish crossover is in place, it lacks decisive momentum.
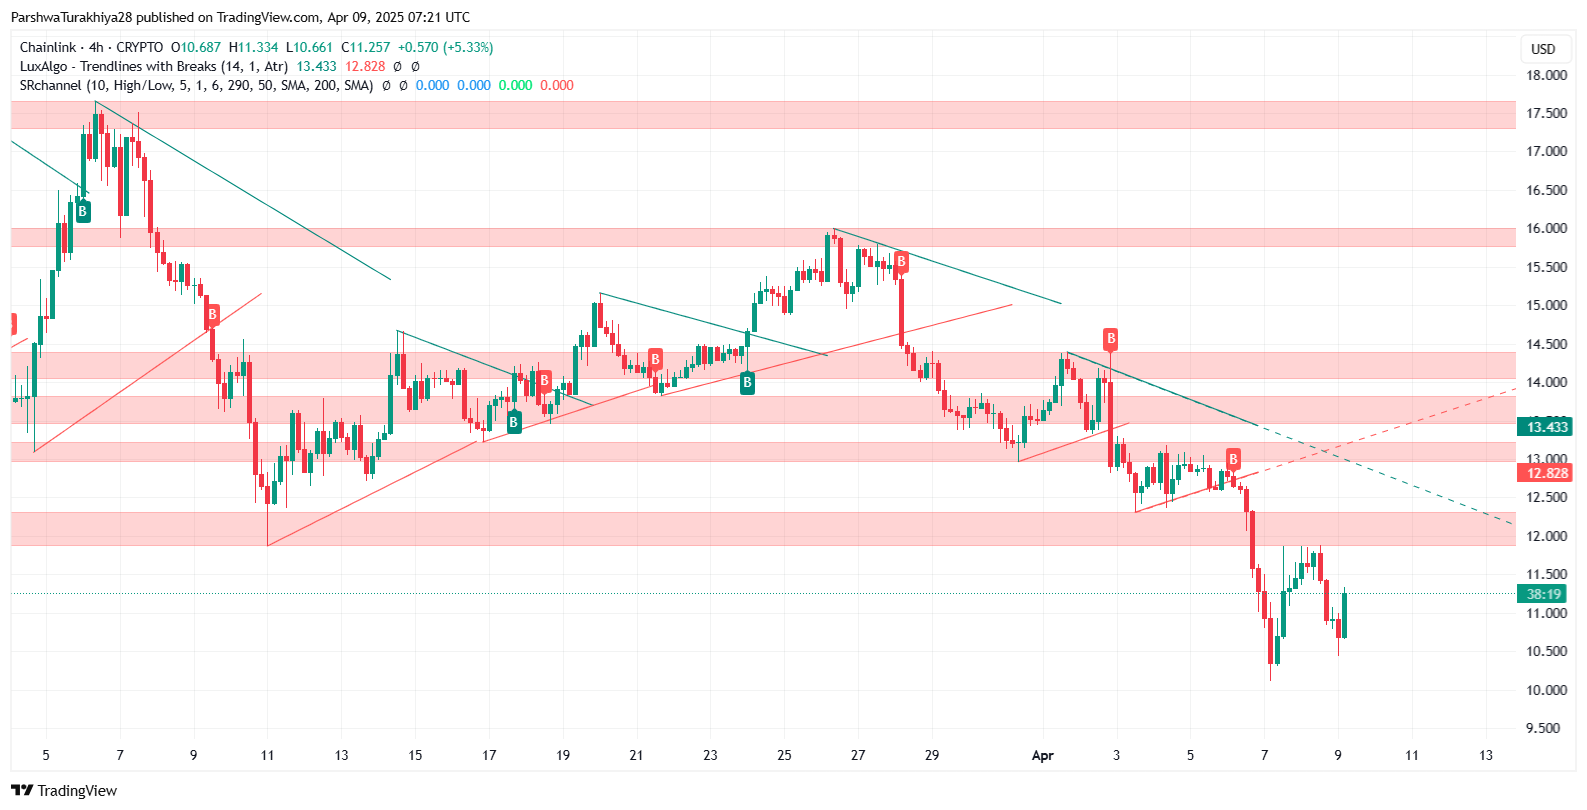
LINK/USD price dynamics (March 2025 - April 2025) Source: TradingView.
Resistance looms at $12.30–$13.40 zone
The next key levels to watch lie between $12.17 and $13.44, corresponding to the 0.382 to 0.618 Fibonacci retracement zones. These levels also align with supply clusters and EMA resistance on the 4-hour chart. The 20 EMA at $11.51 and the 50 EMA at $12.29 are currently above the price, highlighting the importance of reclaiming these to shift market structure. The 200 EMA at $13.99 remains the macro target for bulls aiming to reverse the broader downtrend.
Until LINK reclaims $13.40 with strong volume and bullish confirmation, it remains in a consolidation phase. A failure to break above this cluster could reinforce bearish sentiment, exposing LINK to a retest of the $10.50 zone.
In earlier updates, we highlighted that LINK was nearing its accumulation zone, and a wedge pattern was forming. The current price action confirms this, but without a decisive breakout, upside targets remain speculative.


