Cardano price teases breakout as bulls eye $0.72 resistance amid triangle consolidation
 Cardano consolidates under $0.66 as traders await confirmation breakout
Cardano (ADA) shows early signs of a potential technical breakout as it consolidates near a multi-week descending trendline, trading at $0.6259 on April 11. Price action suggests an approaching resolution of the symmetrical triangle that has formed following a prolonged downtrend. Bulls have managed to reclaim key moving averages, setting the stage for a possible push above the $0.657–$0.66 resistance zone.
ADA’s recent price structure on the 4-hour chart reflects growing bullish pressure. The token is pressing against the upper boundary of its triangle formation, with confluence from the 200 EMA ($0.6827) and a descending trendline that has historically rejected upward momentum. A bullish crossover between the 20 EMA ($0.606) and 50 EMA ($0.6165) has just occurred, signaling early upward alignment in short-term momentum. However, ADA must break and hold above $0.657 to validate a shift in broader sentiment.
Momentum indicators support this view. The RSI is trending upward at 56.22, with enough headroom before approaching overbought territory, while the MACD line (0.0054) has crossed above the signal line (0.0046) with growing histogram bars—pointing to accelerating momentum. Price is also hugging the upper Bollinger Band, suggesting rising volatility could soon drive a breakout.
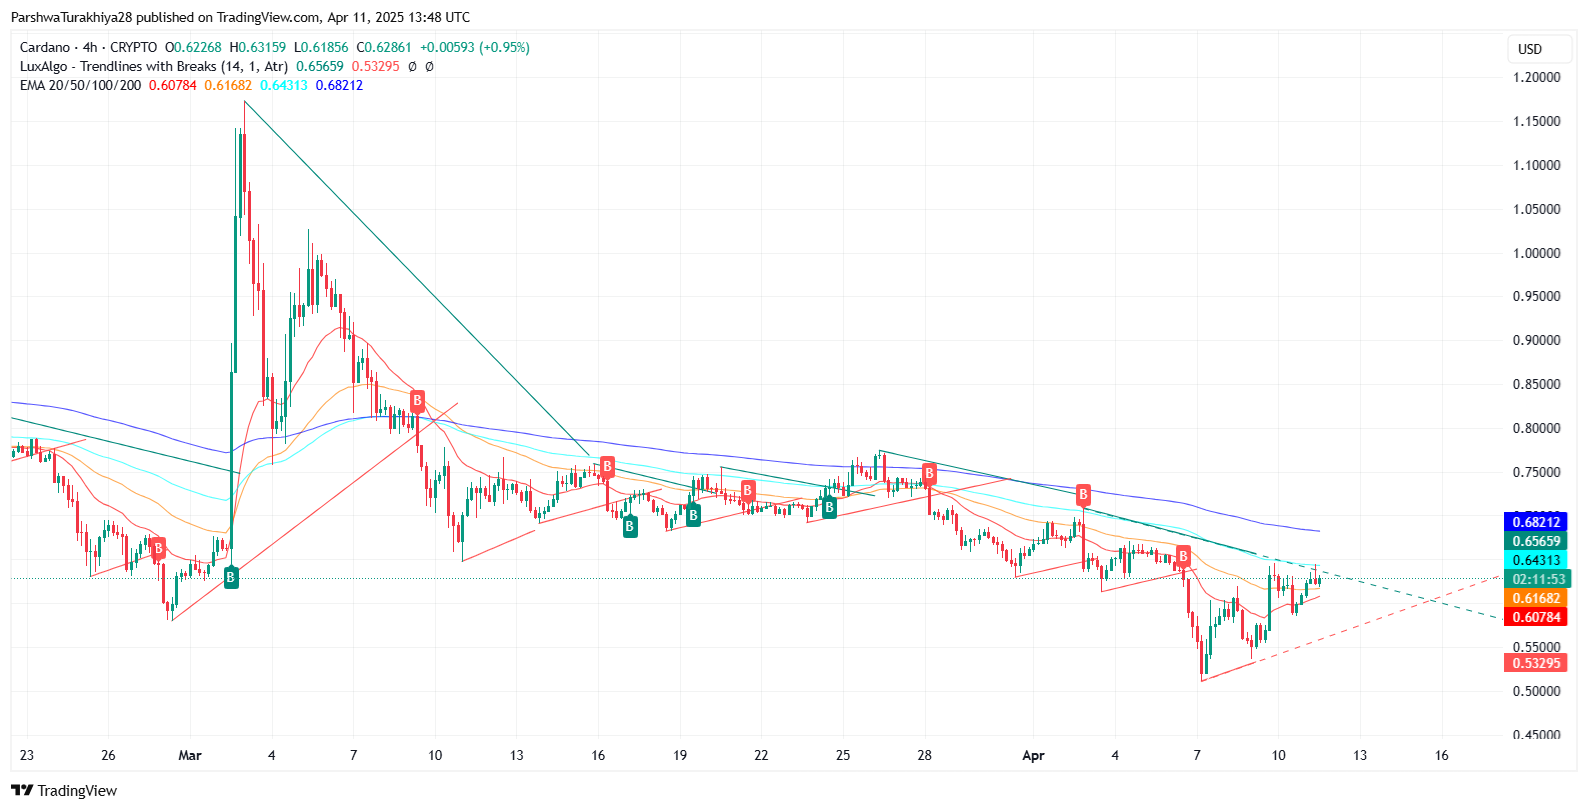
Cardano price movement (February 2025 - April 2025) Source: TradingView.
Upside targets and downside risk levels
If ADA can break above $0.657 on strong volume, Fibonacci projections suggest immediate upside targets at $0.72 (0.382 retracement) and $0.765 (0.5 level), both of which align with prior resistance zones from late February. Failure to breach this trendline resistance, however, could result in a retracement to $0.58 or the more substantial support range near $0.55.Bulls appear to be regaining control, but confirmation above $0.66 and the 200 EMA is needed to shift the medium-term trend. Until then, Cardano remains in a technically neutral zone with a bullish bias.
In our earlier technical breakdown, we identified the $0.657–$0.66 zone as the make-or-break resistance. That level remains pivotal, and a confirmed breakout could mark the first major trend reversal in weeks.


