XRP price falls below $2.17 as momentum fades and technical pressure builds
 XRP price trades near $2.08 as technical resistance at $2.17 caps upside breakout attempts
XRP is currently trading near $2.078 after failing to break above the $2.17–2.22 resistance zone, weighed down by technical overheads. Despite holding the uptrend line from April lows, the broader bias remains bearish as the token remains below all major exponential moving averages (EMAs), including the 100 and 200 EMAs on the 4-hour chart. The “death cross” structure between EMAs highlights a persistent supply zone above, with $2.17 acting as the key pivot for any trend reversal.
The 14-period RSI stands at 47.61, reflecting neutral to bearish momentum, while the MACD has flipped slightly negative after a failed bullish crossover. Bollinger Bands and Keltner Channels show price nearing the lower bounds, with bands tightening around current levels—suggesting a volatility breakout may be on the horizon.
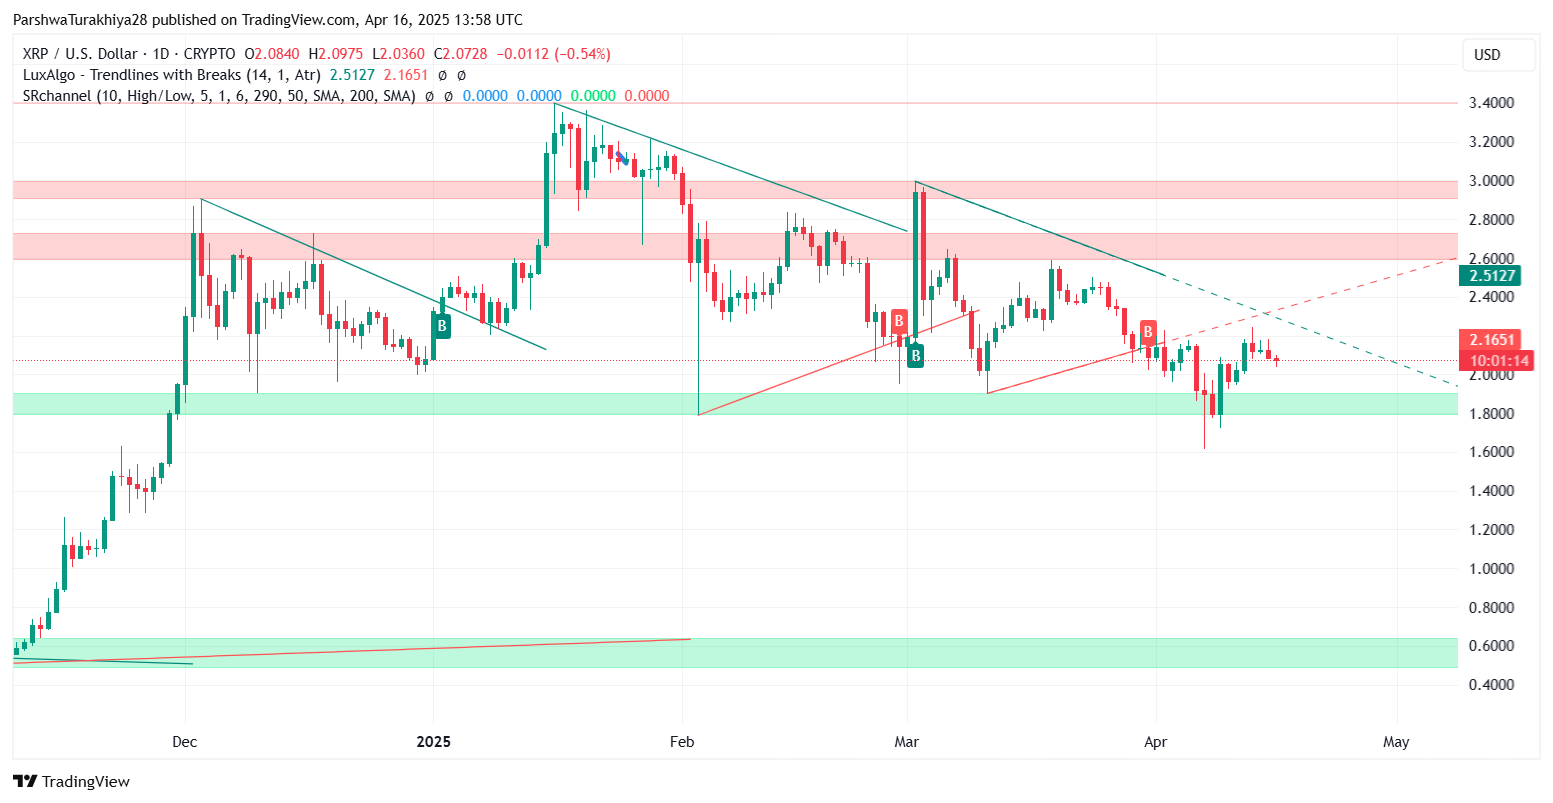
XRP price dynamics (December 2024 - April 2025) Source: TradingView.
Short-term signals tilt bearish despite oversold indicators
On the 30-minute chart, XRP has formed a lower-high structure beneath the $2.13–2.17 resistance. Minor support lies at $2.06, with price struggling to generate volume follow-through. The Stochastic RSI is in oversold territory but has yet to cross upward, signaling that any rebound could remain limited unless accompanied by confirmation on higher timeframes.
The daily chart offers broader perspective. XRP continues to move within a descending channel, with dynamic resistance from the 200 EMA pressing downward from $2.165. The green demand zone between $1.80 and $1.90 has twice defended against steeper declines. For the medium-term trend to turn bullish, XRP must break out of the channel and post a decisive daily close above $2.50.
As highlighted in previous analysis, XRP faces an uphill battle unless price reclaims the 200 EMA and clears multi-session resistance zones. Current conditions suggest a likely retest of $2.00 unless a reversal is confirmed via MACD crossover and RSI divergence.


