Bitcoin price hovers near $84,700 amid death cross signals
 Geopolitical uncertainty and monetary policy expectations continue to weigh on risk assets
As of April 18, 2025, Bitcoin (BTC) is trading near $84,700, consolidating just above a major support level at $83,000.
The technical setup has grown increasingly cautious, with multiple bearish signals flashing across the charts. A notable development is the formation of a death cross, where the 50-day moving average has crossed below the 200-day moving average. This historically bearish signal often precedes extended downtrends, and it underlines a potential shift in market structure.
Momentum indicators suggest a lack of clear bullish conviction. The Relative Strength Index (RSI) sits at 52, which is neutral but leaning slightly bearish given the recent price weakness. It reflects a market that has not yet become oversold, suggesting more room for downside. The MACD indicator also remains flat and slightly negative, hinting that any upcoming rally may lack strength without a strong catalyst.
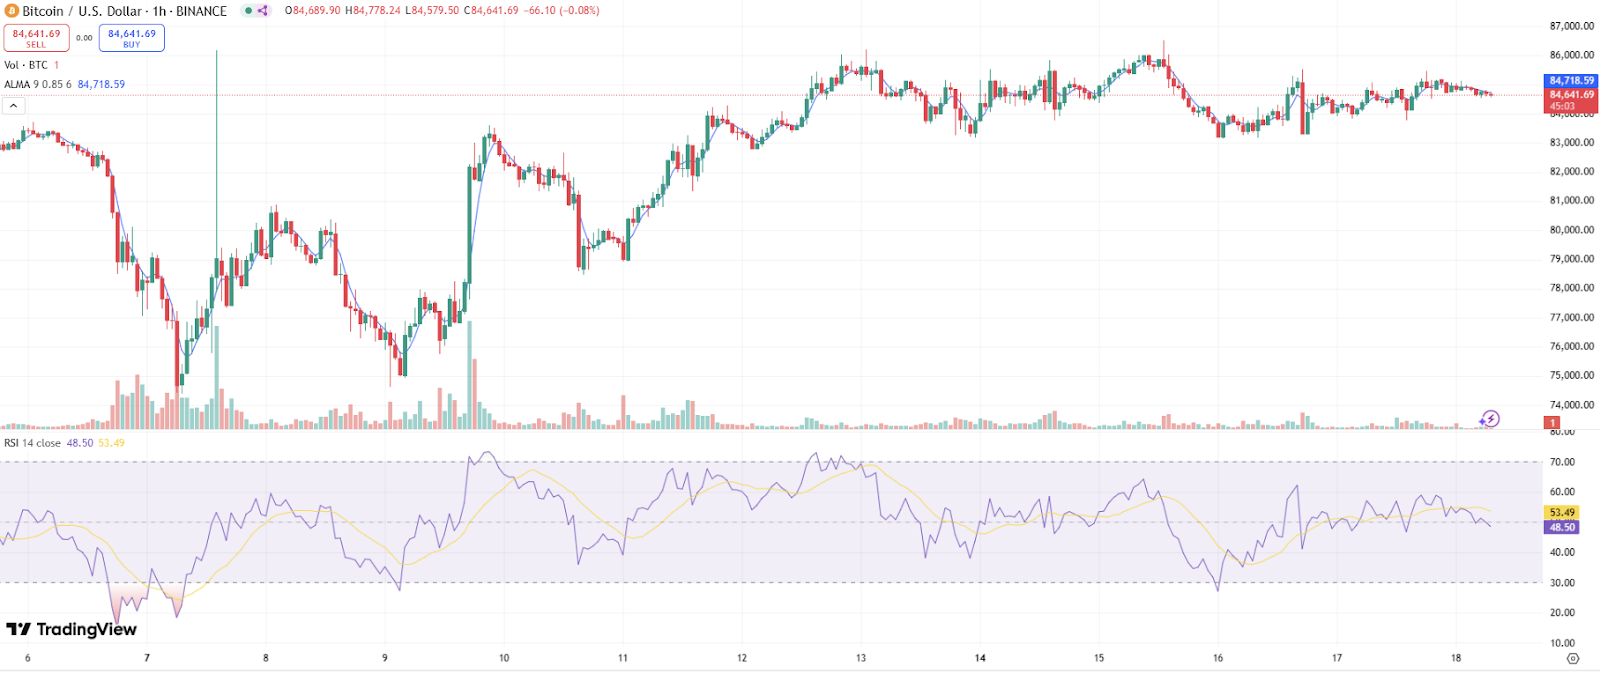
BTC price dynamics (February 2025 - April 2025). Source: TradingView.
Support levels to watch include $83,000—the current pivot point—followed by $81,000 and the more significant $76,500 area. A break below this latter zone would likely trigger aggressive selling and test the psychological $75,000 level, which has previously acted as a rebound zone. Resistance is stacked above, with the 50-day and 200-day moving averages converging near $87,000–$88,500, forming a critical barrier. If bulls reclaim this area, attention will shift toward $92,000 and ultimately $100,000, a major psychological resistance.
Macroeconomic pressures and investor sentiment
Bitcoin's current price movements cannot be fully understood without examining broader macroeconomic conditions. Geopolitical uncertainty and monetary policy expectations continue to weigh on risk assets, including cryptocurrencies. Rising tensions between the United States and China over trade have introduced renewed market volatility. Bitcoin dropped briefly below $80,000 earlier this week in reaction to concerns about potential tariff escalations and the global economic fallout that could follow.
Additionally, U.S. economic data has continued to show mixed signals. Inflation remains above the Federal Reserve’s target, keeping rate-cut expectations in check. The result is a risk-off environment where investors are unwilling to deploy fresh capital into volatile assets like cryptocurrencies. Institutional flows into Bitcoin have notably slowed, as seen by the reduced inflows into spot BTC ETFs compared to Q1 2025.
Another important factor is the recent wave of long position liquidations. On-chain data reveals significant leveraged long positions were wiped out as Bitcoin broke below $85,000, adding to downward pressure. This aligns with broader risk-aversion trends, especially as crypto investors remain cautious about macro-driven surprises.
Сautious optimism with downside risk
In the immediate term, Bitcoin’s outlook remains precarious. If the $83,000 support level fails to hold, the next leg down could target $81,000 and then $76,500. These levels must hold to prevent a deeper correction toward $70,000–$72,000. Any such drop would represent a nearly 20 percent drawdown from current prices, which could provoke further panic selling among retail investors.
However, if Bitcoin maintains support above $83,000 and manages to clear the $88,500 resistance area—particularly if it happens on strong volume—then a move toward $92,000 is likely. Above this, the path toward the psychologically important $100,000 level would reopen. Such a move would likely coincide with a macro catalyst, such as softer inflation data or a dovish Federal Reserve stance, reigniting interest in crypto assets.
Last week, Bitcoin rebounded from its April low of $74,400 but stalled near the $86,200 resistance, where the 50-day EMA and 78.6% Fibonacci retracement converge. The price has since consolidated between $83,600 and $86,200, trading near $84,500 as bulls and bears await a decisive breakout.


