Dogecoin trades below $0.158 as volatility tightens and breakout setup emerges
 Dogecoin trades sideways as key resistance at $0.158 holds and volatility nears breakout trigger
Dogecoin (DOGE) continues to consolidate in a tight range just below a key descending trendline that has restricted upward movement since early April. Currently trading near $0.156, the memecoin remains trapped between resistance at $0.158–$0.160 and immediate support at $0.152. Price action is forming a symmetrical triangle on the 4-hour chart, a common pattern preceding a breakout, though momentum remains subdued.
Technical indicators point to indecision. The RSI on the 4H chart sits at 46.16, reflecting a slight bullish bias with no clear trend strength. The MACD line (0.00011) is nearly flat against the signal line (-0.00108), and the histogram has printed almost neutral bars, confirming a lack of directional conviction. Meanwhile, Bollinger Bands and Keltner Channels continue to narrow between $0.150 and $0.162, suggesting that volatility is compressing to levels that typically precede explosive moves.
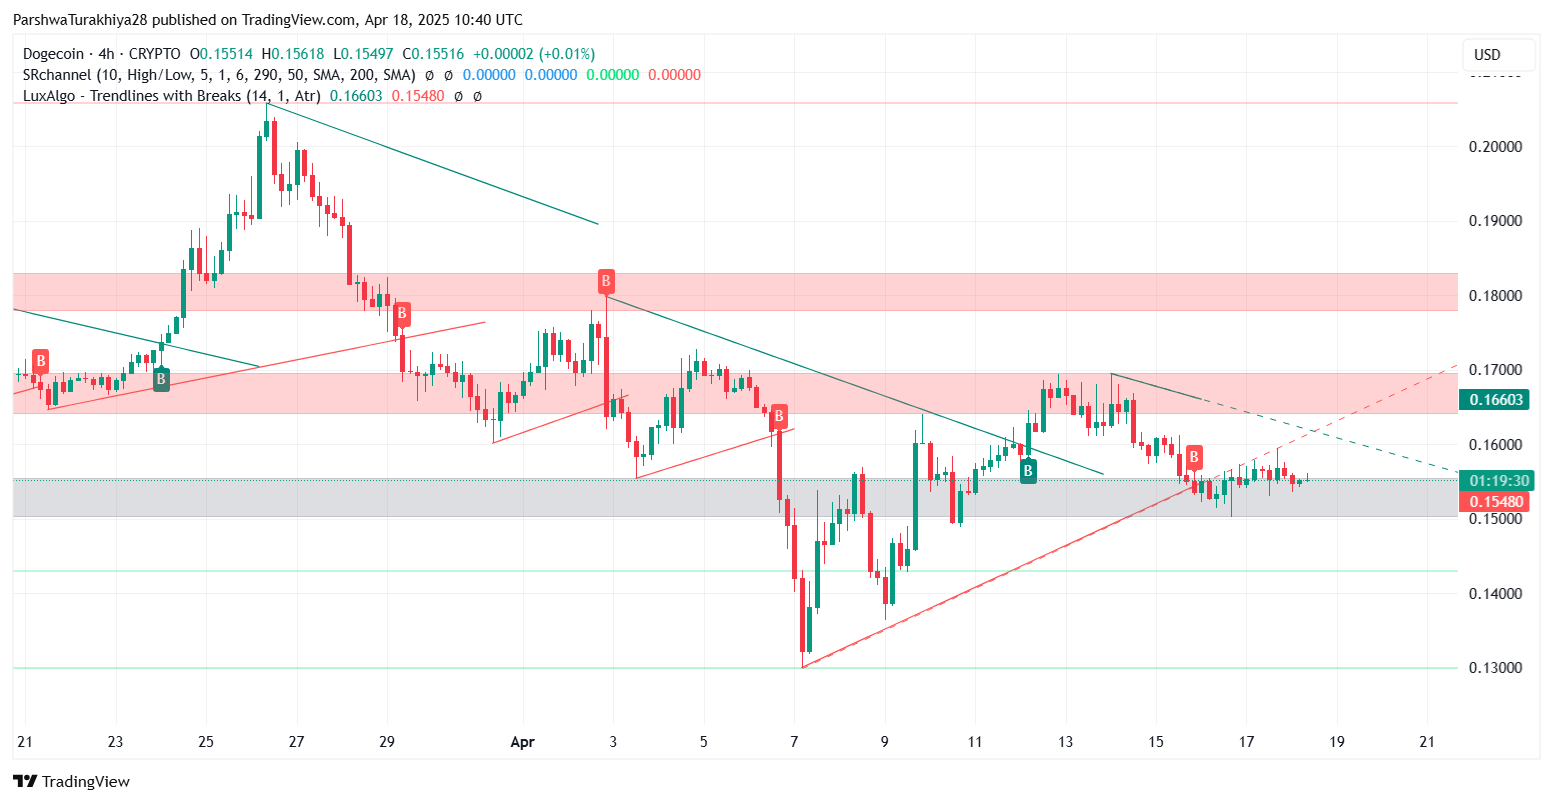
Dogecoin price analysis (March 2025 - April 2025) Source: TradingView.
Daily trend structure shows broader downtrend remains intact
On the daily chart, DOGE continues to print lower highs and lower lows since its February peak, with the broader trend still leaning bearish. A horizontal resistance zone around $0.167–$0.195 remains unbroken, while downside support near $0.140 continues to hold. Daily candles show stabilization near recent lows, indicating demand, but a confirmed breakout is necessary to reverse the broader bearish structure.
Intraday action on the 30-minute chart reflects micro breakout attempts, with repeated failure at $0.15789 and consistent demand near $0.15378. A close above $0.158 could trigger a short-term move toward $0.160–$0.162, while a loss of $0.152 may expose DOGE to the $0.147 and $0.140 support zones.
Our earlier analysis highlighted DOGE’s weakening momentum and symmetrical compression as signs of an impending move. The breakout level at $0.15885 and downside pivot at $0.15233 remain key zones to watch for trend confirmation.


