Ethereum coiling for breakout as price tests triangle resistance near $1,660
 Ethereum trades inside symmetrical triangle as bulls eye breakout
Ethereum (ETH) is currently navigating a key technical juncture, trading around $1,592.22 as of Thursday. The 4-hour chart highlights a narrowing symmetrical triangle pattern formed over the past month, with price action coiling between descending resistance at $1,656 and rising support at $1,568.
This setup suggests a breakout may be imminent, with bulls and bears preparing for directional confirmation.
The consolidation comes after ETH carved out a series of lower highs since mid-March. Although the token remains below a long-term descending trendline visible on the daily chart, the lower boundary of the triangle has held firm since April 12, forming a base for potential upward momentum. A clean breakout above $1,656 could trigger a move toward $1,720–$1,770, while a breakdown below $1,562 would risk a decline toward the $1,500–$1,520 zone.
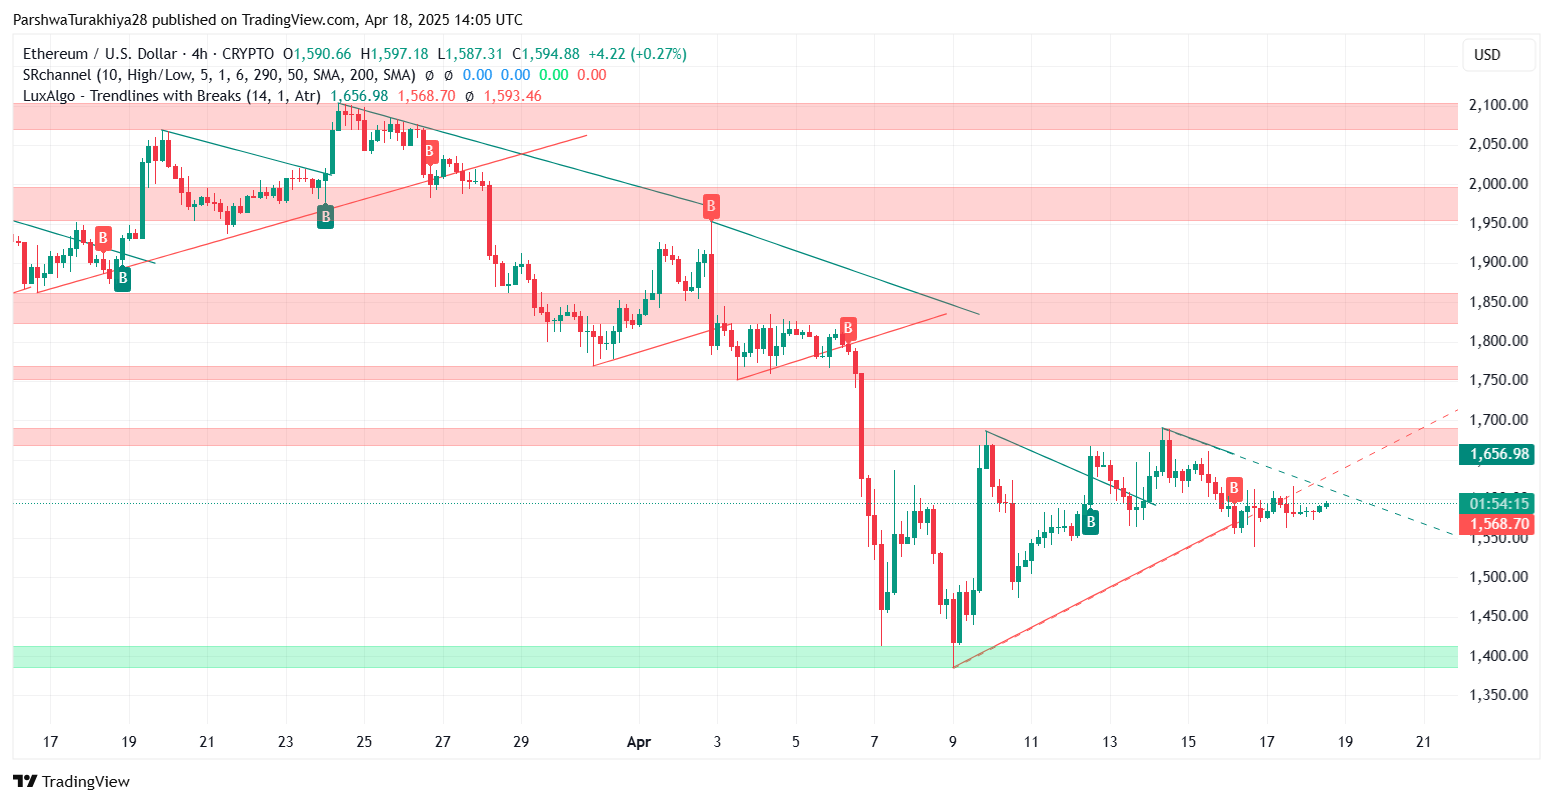
Ethereum price dynamics (March 2025 - April 2025) Source: TradingView.
Technical indicators show mixed signals as volatility contracts
Bollinger Bands on the 4-hour chart have begun to contract, signaling reduced volatility and a likely breakout setup. The price currently hovers near the midline around $1,591. The MACD shows early bullish signs with a crossover, but histogram momentum remains flat, hinting at indecision.
The RSI is neutral at 49.19, reflecting an evenly balanced market, while the Stochastic RSI has flattened after exiting oversold territory, awaiting renewed momentum. Moving averages on the 4-hour chart are stacked favorably, with the 20 EMA ($1,592.55), 50 EMA ($1,605.52), and 100 EMA ($1,658.75) all reclaimed. Still, ETH remains well below the 200 EMA ($1,794) on the daily chart, maintaining a bearish medium-term bias.
What to watch next
Traders are closely monitoring a breakout above the $1,656–$1,660 band for confirmation of bullish reversal. If ETH clears that zone with volume support, it could open upside potential toward the $1,750–$1,800 region. On the downside, failure to hold above $1,562 could lead to a retest of the broader support around $1,500.
In our earlier ETH coverage, we identified the $1,500–$1,520 zone as a strong base for accumulation. That zone remains valid unless ETH breaks below trend support, in which case the next flush may aim toward March lows.


