Shiba Inu price breaks key resistance as bullish structure gains traction above $0.000012
 Shiba Inu charts signal recovery as price tests major resistance near 0.00001260
Shiba Inu (SHIB) is showing signs of trend reversal after successfully breaking above a descending resistance line that had capped its price since early April. Trading near 0.00001225 on Thursday, SHIB has reclaimed key support levels and is pushing toward a critical resistance band between 0.00001250 and 0.00001260. The upward move follows a sharp rebound from April 13 lows, supported by an ascending trendline and a bullish crossover on shorter-term EMAs.
On the 4-hour chart, SHIB has cleared the 20 and 50 EMA levels and now tests the 200 EMA at 0.00001247, which historically has served as dynamic resistance. A close above this could pave the way toward 0.00001380 and 0.00001450, the next major resistance bands. Indicators align with this shift—MACD has turned positive with growing histogram bars, and Bollinger Bands are expanding after a period of compression, signaling higher volatility. RSI currently sits at 64.38, showing bullish momentum without being in overbought territory, though the Stochastic RSI is in the extreme zone, hinting at possible short-term exhaustion.
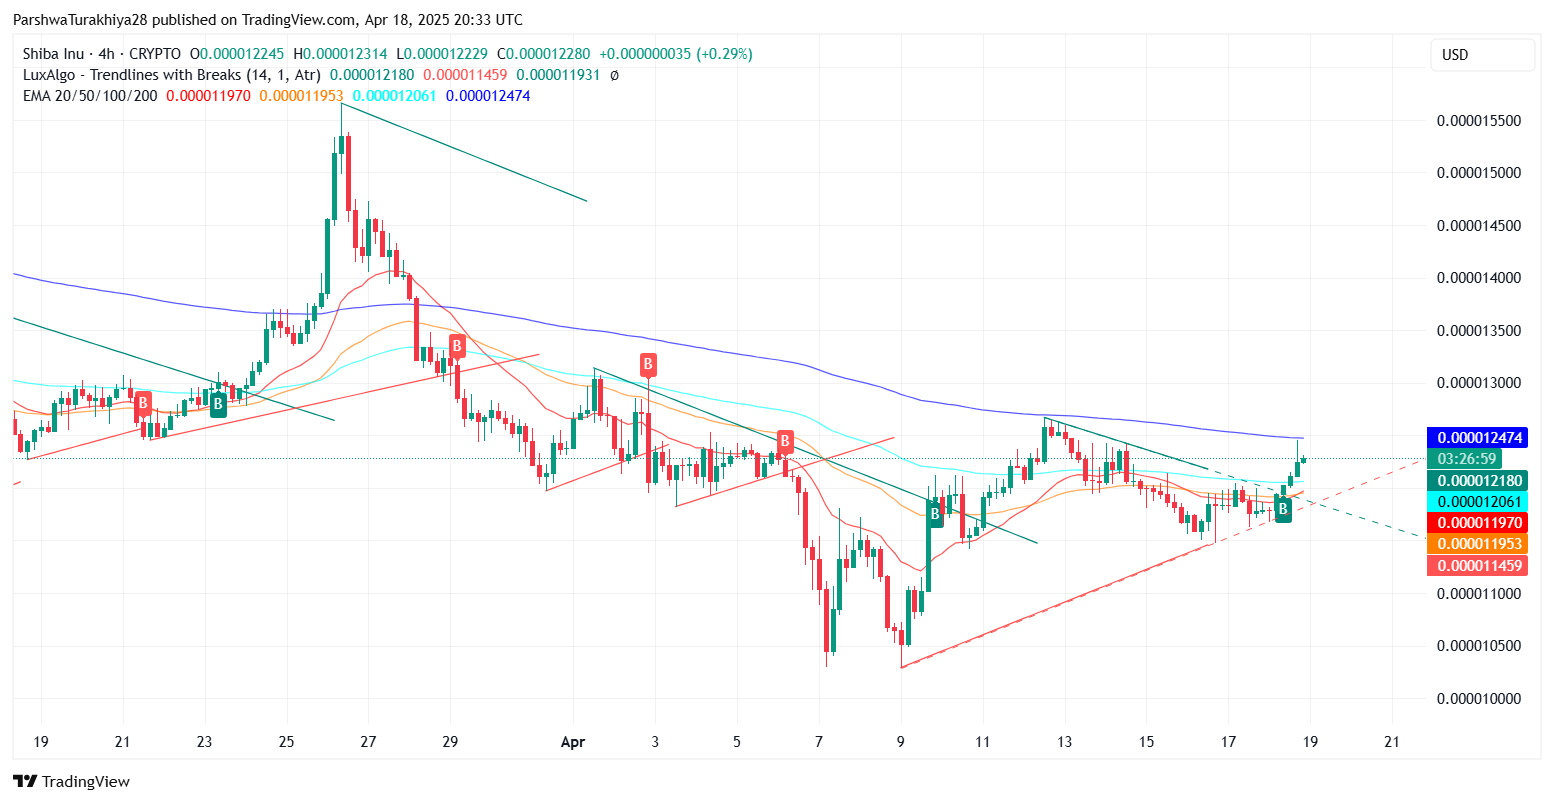
Shiba Inu price movement (March 2025 - April 2025) Source: TradingView.
Technical confluence and long-term resistance ahead
SHIB is now testing a zone that aligns with the 0.236 Fibonacci retracement level from the broader downtrend. Volume has picked up during the breakout, suggesting potential for trend continuation, though further confirmation is needed. The Keltner Channel upper boundary also overlaps this resistance zone, adding weight to the short-term test. A sustained move above 0.00001260 would signal a breakout continuation and invite bullish entries targeting the 0.00001400–0.00001500 range.
However, on the daily chart, SHIB remains in a broader downtrend and would need to reclaim the 0.00001500–0.00001550 level, coinciding with the 0.618 Fib zone, to validate a long-term reversal. Failure to hold above 0.00001200 could trigger a drop toward support at 0.00001150 or even the March low of 0.00001080.
In prior coverage, we noted SHIB’s vulnerability below the 0.00001200 level. With a breakout now confirmed, bulls are gaining control, but only a sustained move above 0.00001450–0.00001500 will confirm a longer-term trend reversal.


