Solana price struggles to break $152 amid short-term consolidation and waning momentum
 Solana (SOL) hovers around $146 as momentum cools after rally
Solana (SOL) is showing signs of exhaustion after a strong rally above the $140 mark, consolidating near $146 in Thursday's session. The token briefly touched $151 earlier this week before encountering resistance, coinciding with a rejected retest of a broken ascending trendline.
While the short-term structure remains bullish, with price still holding above all major moving averages, indicators suggest a pause or correction could be underway before the next leg higher.
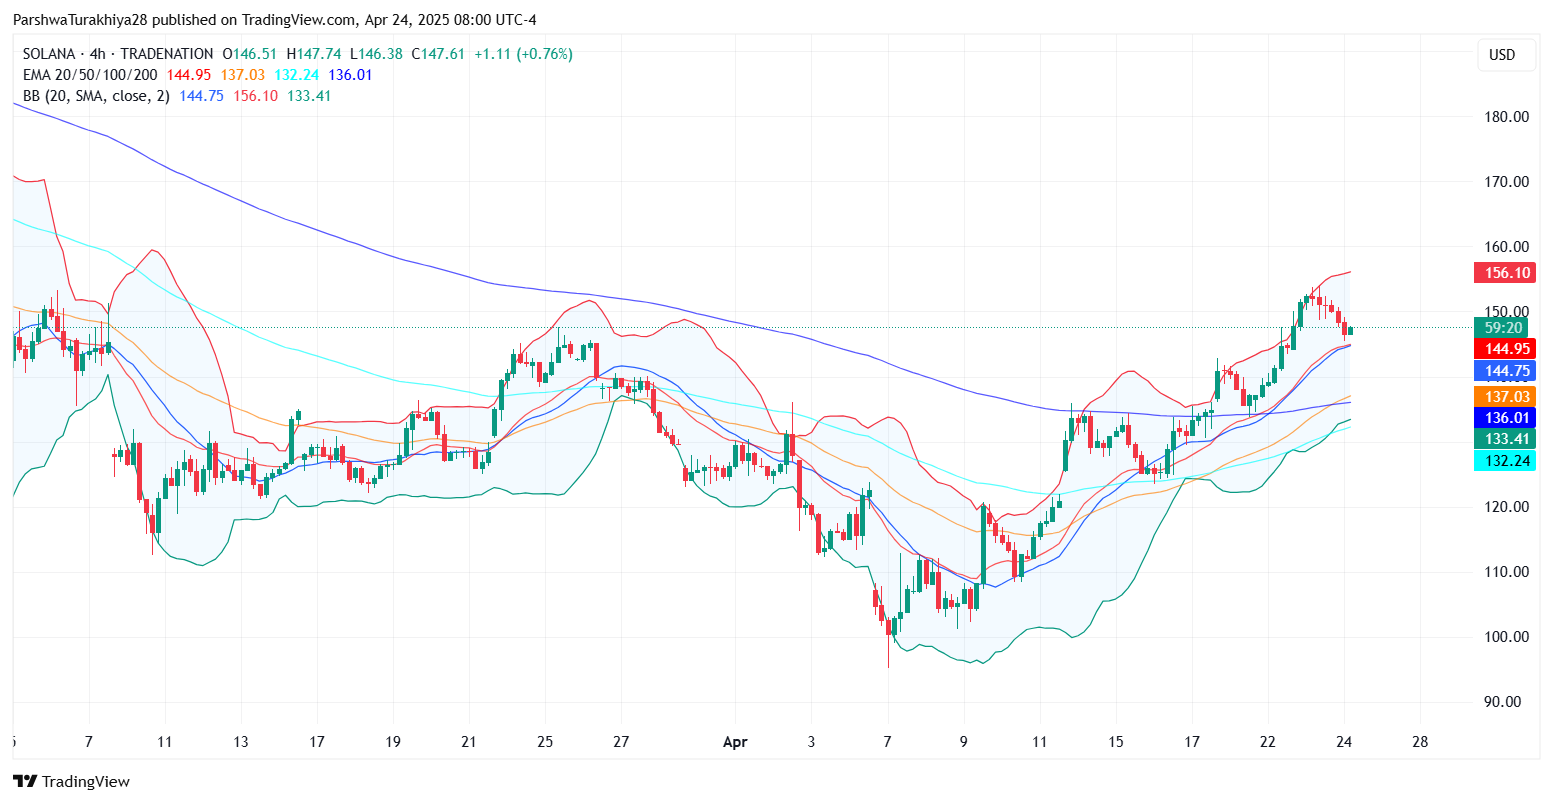
Solana price forecast (March 2025 - April 2025) Source: TradingView.
EMAs hold, but momentum indicators flash caution
The recent rejection from $151–$152 coincides with the upper band of a rising wedge structure on the 30-minute chart and the daily horizontal resistance that has consistently capped rallies since February. Despite this pullback, Solana continues to trade above its 20, 50, 100, and 200 EMAs on the 4-hour chart, with the 20 EMA at $144.89 now serving as immediate support. The convergence of these EMAs around the $132–137 zone underscores this region as a key pivot if downside pressure builds.
Momentum indicators reflect cooling conditions. The RSI has declined from overbought territory and currently sits near 61 on the 4-hour chart, maintaining bullish bias but lacking fresh buying impulse. Meanwhile, the MACD has printed a shallow bearish crossover, with histogram bars fading, suggesting deceleration in upside momentum.
Bollinger Bands and Keltner Channels are tightening, signaling volatility compression and a potential breakout setup in the coming sessions.For bulls to regain control, a decisive close above $154 is needed, which could open the door to targets near $165 and $170. Conversely, if support at $144.50 fails, Solana risks a retracement toward the $137–$132 region, where a cluster of EMAs and volume pockets converge.
Solana had already flipped the $127–130 zone into support in our last analysis. As long as SOL holds above this reclaimed base and maintains strength above the 20 and 50 EMAs, the bullish trend remains intact, though temporary pullbacks like the current one are healthy in the broader uptrend.


