Shiba Inu price tests resistance as bullish triangle structure builds momentum
 SHIB/USD tests 0.00001450 resistance within bullish triangle as momentum builds across timeframes
Shiba Inu (SHIB) continued to consolidate near the 0.00001400 mark on Monday, with price action signaling the potential for a breakout from a rising triangle pattern visible across multiple timeframes. The meme token has climbed over 20% since its mid-April base near 0.00001200 and is currently hovering near the 0.00001450 resistance zone—a level that has capped multiple upside attempts in recent sessions.
The broader recovery began with a breakout from a descending trendline on the daily chart and is now supported by a sequence of higher lows and bullish realignment across short-term EMAs. The 4-hour chart shows SHIB holding comfortably above the 20, 50, 100, and 200 EMAs, with the 20 EMA positioned at 0.00001380. However, the path higher remains dependent on price closing above the key resistance zone near 0.00001450.
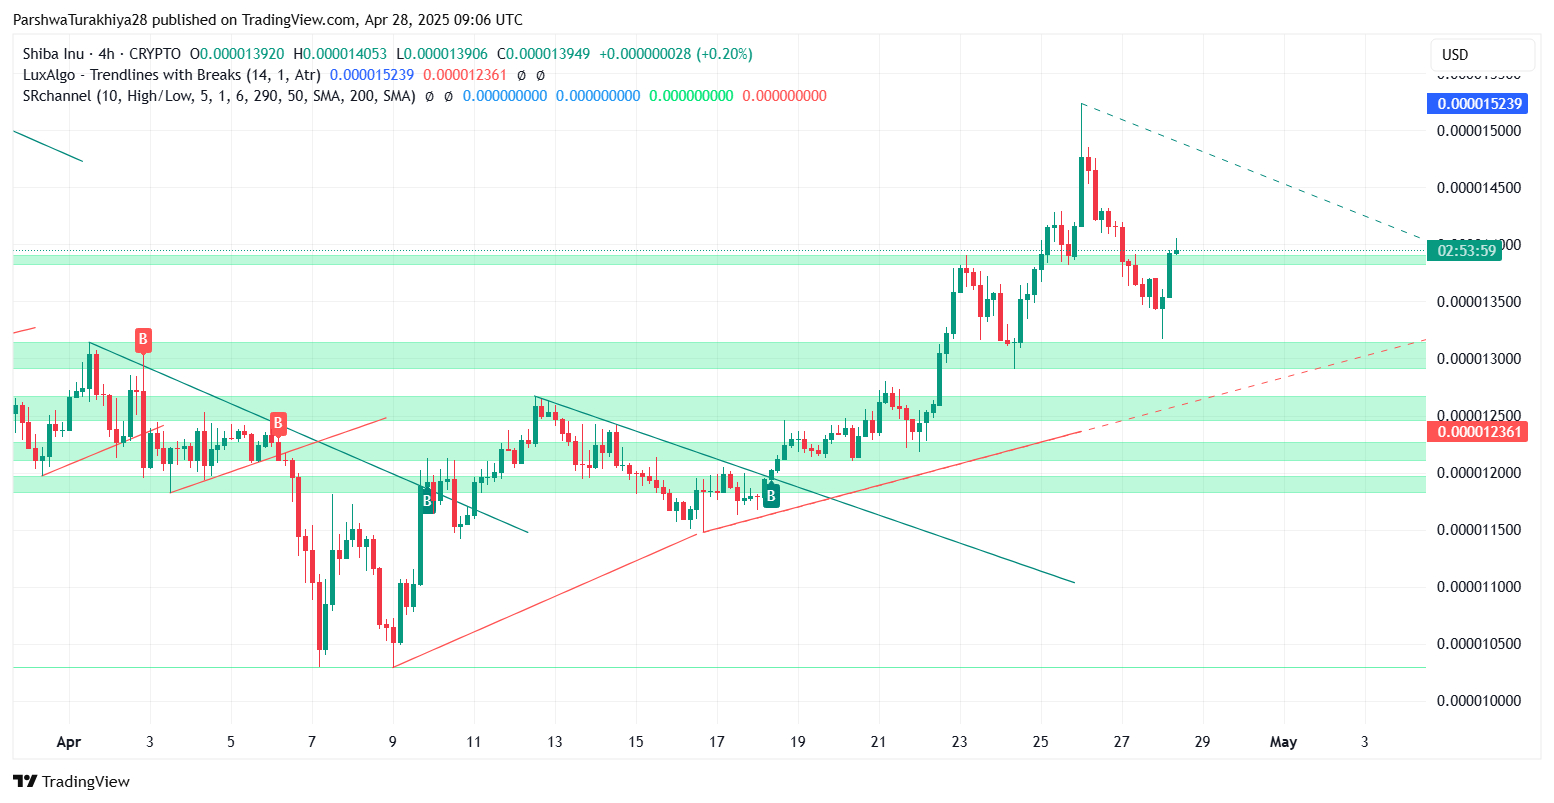
Shiba Inu price analysis (April 2025) Source: TradingView.
Momentum mixed but turning constructive
The Relative Strength Index (RSI) has rebounded from overbought levels and now prints near 53.84 on the 4H timeframe—suggesting momentum is building again without being overstretched. Meanwhile, the MACD remains slightly bearish following a recent crossover, but flattening momentum hints at a possible reversal. The histogram, while still negative, is contracting, and a bullish MACD crossover could confirm a fresh impulse toward 0.00001520 or higher.
Microstructure on the 30-minute chart reflects intraday accumulation, with a bullish engulfing pattern forming just beneath resistance. A sustained move above 0.00001400 could spark renewed buying interest and fuel another leg higher within the triangle.
As long as SHIB remains above its key support range of 0.00001300–0.00001344, the bullish structure remains intact. A breakout above 0.00001450 with volume confirmation could open upside toward 0.00001523 and 0.00001600. However, a failure to reclaim resistance may lead to extended consolidation, or in the event of a breakdown below 0.00001286, a reversal toward 0.00001200.
In earlier analysis, Shiba Inu's recovery was flagged following a breakout above its descending wedge near 0.00001200. That structure continues to play out, with short-term EMAs supporting the uptrend. Key upside levels remain unchanged.


