Shiba Inu price struggles below resistance as bulls attempt recovery from $0.000013 support
 SHIB tests 200-EMA resistance at 0.00001350 after bouncing from support. Breakout needed for upside
Shiba Inu (SHIB) is attempting to recover after dipping below 0.00001350, but technical conditions suggest the token remains vulnerable to another leg down if it fails to sustain upward momentum. The recent bounce from the 0.00001300 zone has brought SHIB back toward its intraday supply region, but multiple resistance factors continue to weigh on the asset’s upside potential.
SHIB is trading near the lower Bollinger Band on the 4-hour chart, signaling short-term oversold conditions. This is reinforced by the MACD histogram, which is beginning to flash early signs of bullish divergence, although the MACD line remains below zero, suggesting that overall momentum has yet to turn decisively positive. The RSI stands at 45, reflecting weak buying pressure that could recover if SHIB reclaims the 200-EMA at approximately 0.00001350.
Price action across the 30-minute and 4-hour charts highlights a minor breakout from a descending trendline, followed by a soft retest of former resistance. The 0.00001340–0.00001350 area now acts as a critical intraday resistance zone. A successful reclaim here could spark a short-term push toward 0.00001400 and eventually to 0.00001485. Failure, however, may lead to renewed selling pressure, with downside targets at 0.00001300 and 0.00001250.
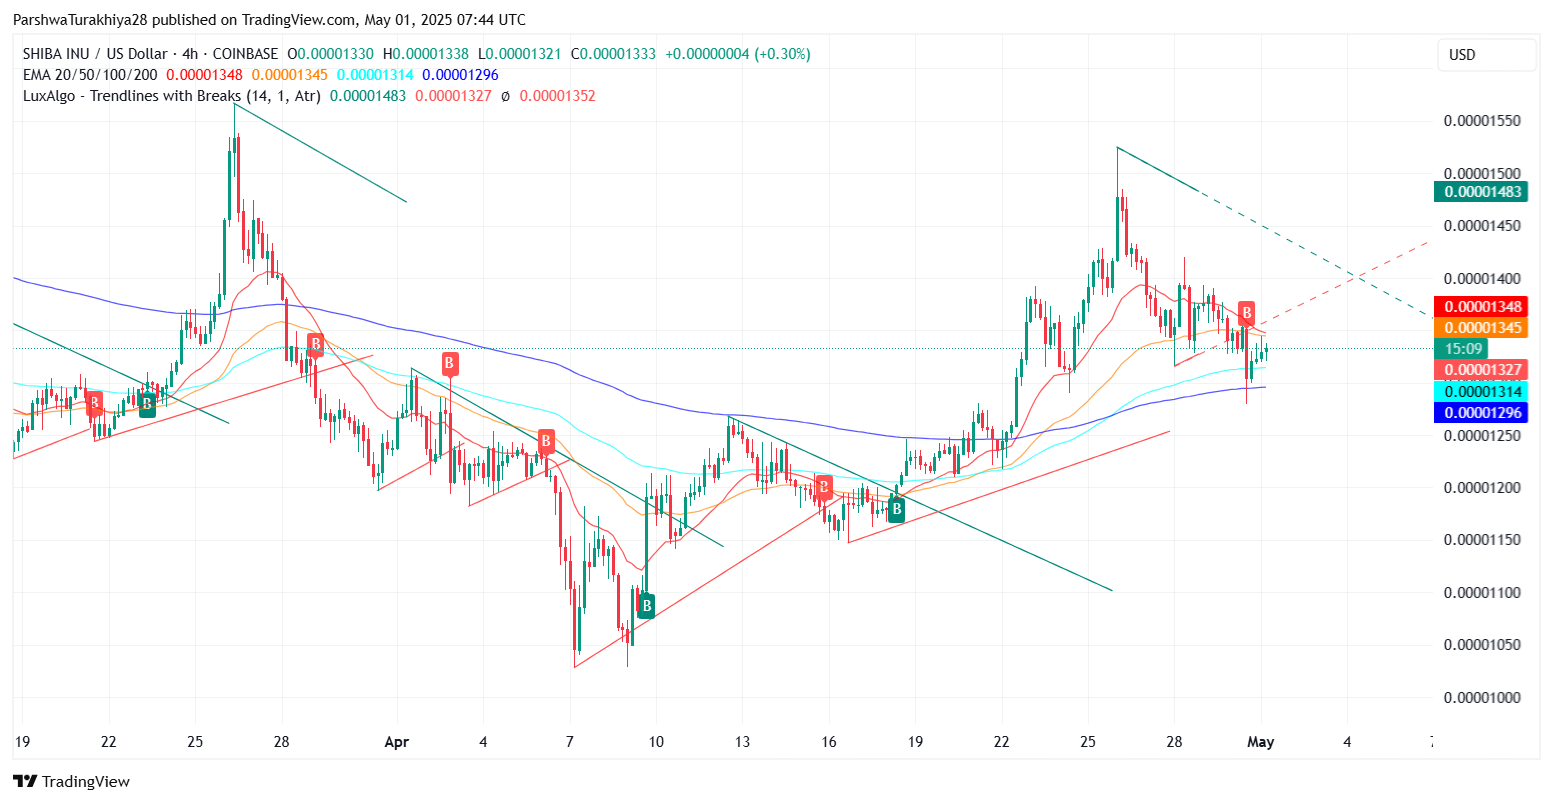
Shiba Inu price prediction (March 2025 - May 2025) Source: TradingView.
Weekly structure maintains cautious tone
On a broader scale, the weekly chart shows SHIB hovering around the 0.786 Fibonacci retracement level at 0.00001500, calculated from the 2024 high of 0.00003344. While this level has historically served as a consolidation floor, the long-term trend remains bearish unless the token breaks above the 0.00001750–0.00001850 resistance band. If current support fails, a drop toward the 0.00001079 Fibonacci extension level cannot be ruled out.
As previously discussed, SHIB’s recent breakout above descending resistance was promising, but the lack of volume and failure to hold above the 200-EMA has prevented sustained bullish momentum. Until bulls reclaim and defend 0.00001350–0.00001400, the price remains exposed to whipsaws amid overlapping resistance and support zones.


