Bitcoin price consolidates inside Doji pattern amid RSI overbought conditions
 Bitcoin has traded tightly around $104,100
Bitcoin’s price action this week has been erratic, marked by broad but directionless movement. After a sharp 12% gain since the start of May, the asset has moved back and forth around its weekly open, consolidating in a range that highlights market indecision.
The week began with a classic Doji candlestick formation—a high at $105,800 and a low at $100,700—spanning a volatile 5% range. Such patterns often point to a tug between buyers and sellers, and when paired with the daily RSI in overbought territory, it suggests that momentum may be stalling. Since then, price has largely respected the Doji boundaries, with even Tuesday’s 1.3% uptick staying contained within the same range.
Bitcoin rally show fatigue as institutional flows weigh against $105.8K ceiling
As of the early European session on Wednesday, Bitcoin has traded tightly around $104,100, showing minimal movement since the Asian hours. This lack of volatility aligns with the idea that the market is either preparing for a trend reversal or digesting recent gains through consolidation.
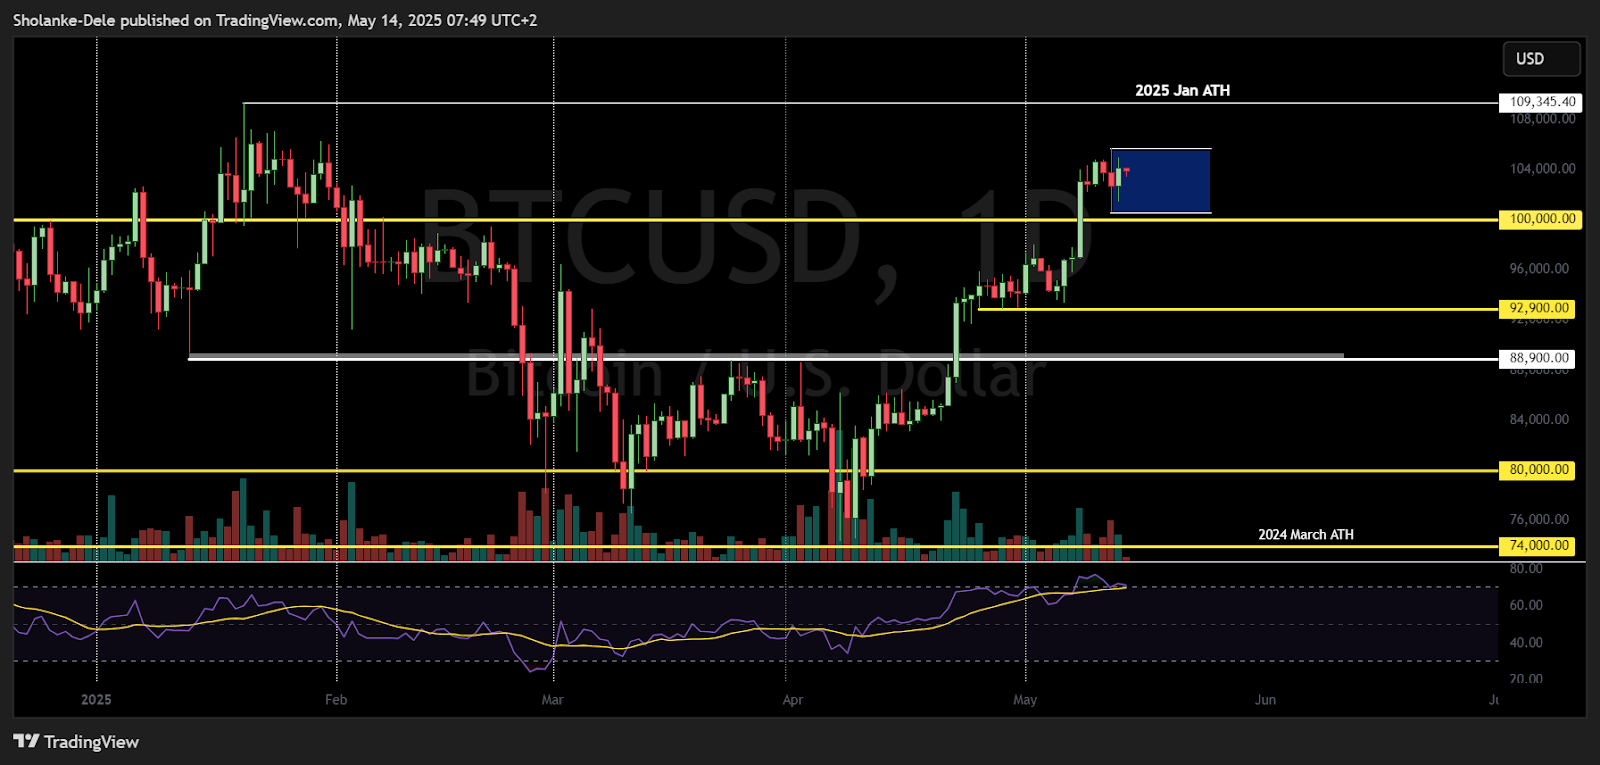
BTC price dynamics (April - May 2025). Source: TradingView
From a technical view, $105,800, the week's initial high, remains a key upside level. A break above this could shift attention towards the all-time high near $109,400. On the flip side, a move below $100,700 could expose the $100,000 psychological level.
Fundamentally, easing tariff tensions between the U.S. and China and a pickup in broader macro sentiment continue to support investor risk appetite. If institutional interest persists under these conditions, Bitcoin could still find fuel to push higher even after the recent rally. For now, the market is watching whether price breaks out of the current range or continues to absorb overbought pressure.
Bitcoin retreated from $105 700 to $102 700 after RSI hit overbought levels. The rising wedge pattern over the weekend signalled weakening bullish momentum.


