Dogecoin price struggles below key resistance as short-term bearish pressure remains
 Dogecoin price faces bearish pressure, testing key support levels after rejection at $0.2345 resistance
Dogecoin price is trading at $0.218, marking a 6% decline over the past 24 hours after a sharp rejection from the $0.2345 resistance zone. Following a strong rally earlier in the month, the momentum has stalled, with DOGE now testing crucial support levels around $0.216.
This drop below the $0.225–$0.230 range reflects increasing bearish sentiment, as price action dips below both the 20-EMA and 50-EMA on the 4-hour chart, suggesting weakening buying interest.
The rejection near trendline resistance and the formation of lower highs suggest that Dogecoin's price volatility may remain skewed to the downside in the short term. The price is hovering near the 0.236 Fibonacci retracement level, which sits at $0.2136, drawn from the November high to the March low. A weekly close below this level would invalidate the earlier breakout attempt, potentially exposing DOGE to further downside, targeting the $0.20–$0.21 range.
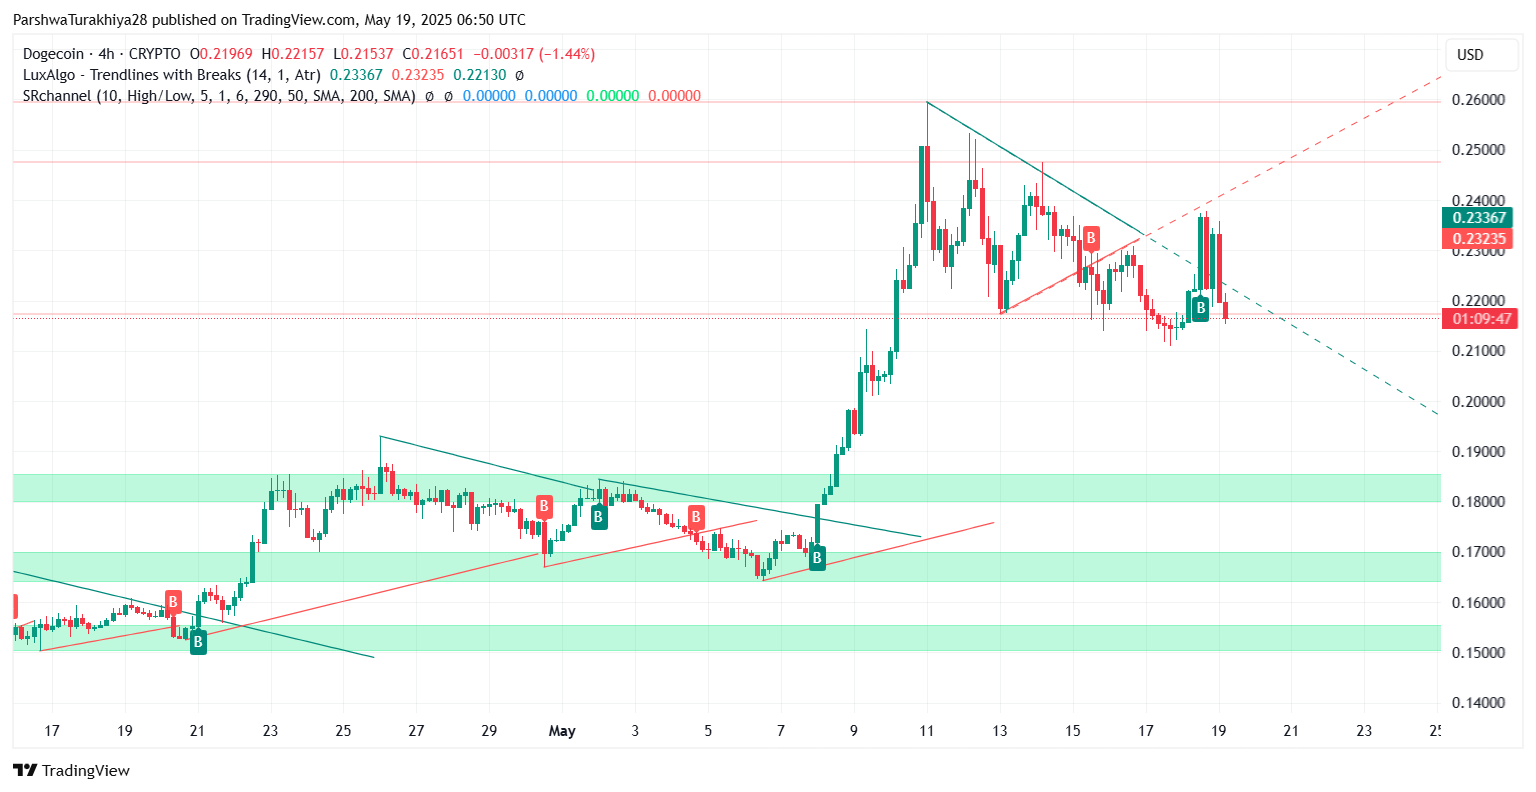
DOGE price dynamics (April 2025 - May 2025) Source: TradingView.
Momentum indicators and bearish setup
Momentum indicators on shorter timeframes reinforce the bearish outlook. The Relative Strength Index (RSI) on the 30-minute chart is sitting near 37.88, nearing oversold territory but still trending downward, suggesting that selling pressure could continue. Meanwhile, the MACD has formed a bearish crossover, with the histogram steadily declining over three consecutive sessions. This setup signals weakening buyer interest and a potential continuation of the downtrend if support levels fail to hold.
The narrowing Bollinger Bands on the 4-hour chart suggest reduced volatility following last week’s sharp move. Unless the price breaks decisively in either direction, DOGE may remain within a consolidation range. The Ichimoku Cloud on the 30-minute chart reflects a bearish sentiment as the price is trading below the cloud, with both the Tenkan-Sen and Kijun-Sen lines pointing lower.
Key support and short-term outlook
Despite the bearish pressure, DOGE remains above a key demand zone between $0.2107 and $0.2160. This area aligns with the lower Bollinger Band, the 100-EMA (4H), and prior intraday lows, offering some support for the asset. A breakdown below this level would likely trigger further losses toward the 200-EMA, which sits at $0.1977. On the upside, reclaiming the $0.2230 level may signal a potential short-term recovery. However, a sustained move above $0.2345 with strong volume would be needed to reverse the broader downtrend.
Heading into May 20, the short-term outlook for Dogecoin remains bearish unless the price holds $0.216 and begins to show signs of bullish momentum. If the selling pressure persists, a retest of the $0.2100 or lower is likely. However, if the $0.216 support level holds and momentum improves, the potential for a recovery toward the $0.23–$0.25 range remains. As previously discussed, Dogecoin is currently caught in a bearish setup, and traders should be cautious of further downside risks if the support levels fail to hold.


