Moodeng price poised for sideways trend on neutral RSI and lower volume
 Moodeng up after three-day drop
Moodeng price is attempting a modest recovery this Thursday after three consecutive bearish daily closes earlier in the week dragged the asset down by 15%. Despite short-term rebounds, technical and volume signals suggest the altcoin is still in a state of indecision.
- Moodeng price bounced from $0.2177 support but lacks follow-through strength
- 4-hour RSI stays neutral, failing to confirm bullish momentum
- Declining trading volume signals consolidation, not trend reversal
The week started on a bearish note for Moodeng, even though the broader crypto market saw strength, led by gains in the alpha cryptocurrency, Bitcoin, which rose to a new record peak. This divergence highlighted weakness in Moodeng-specific sentiment. Price action across the first three trading days reflected consistent selling pressure, culminating in Wednesday’s drop to as low as $0.2177. That level provided support, and the day ended at $0.2317, marking a 5.7% loss.
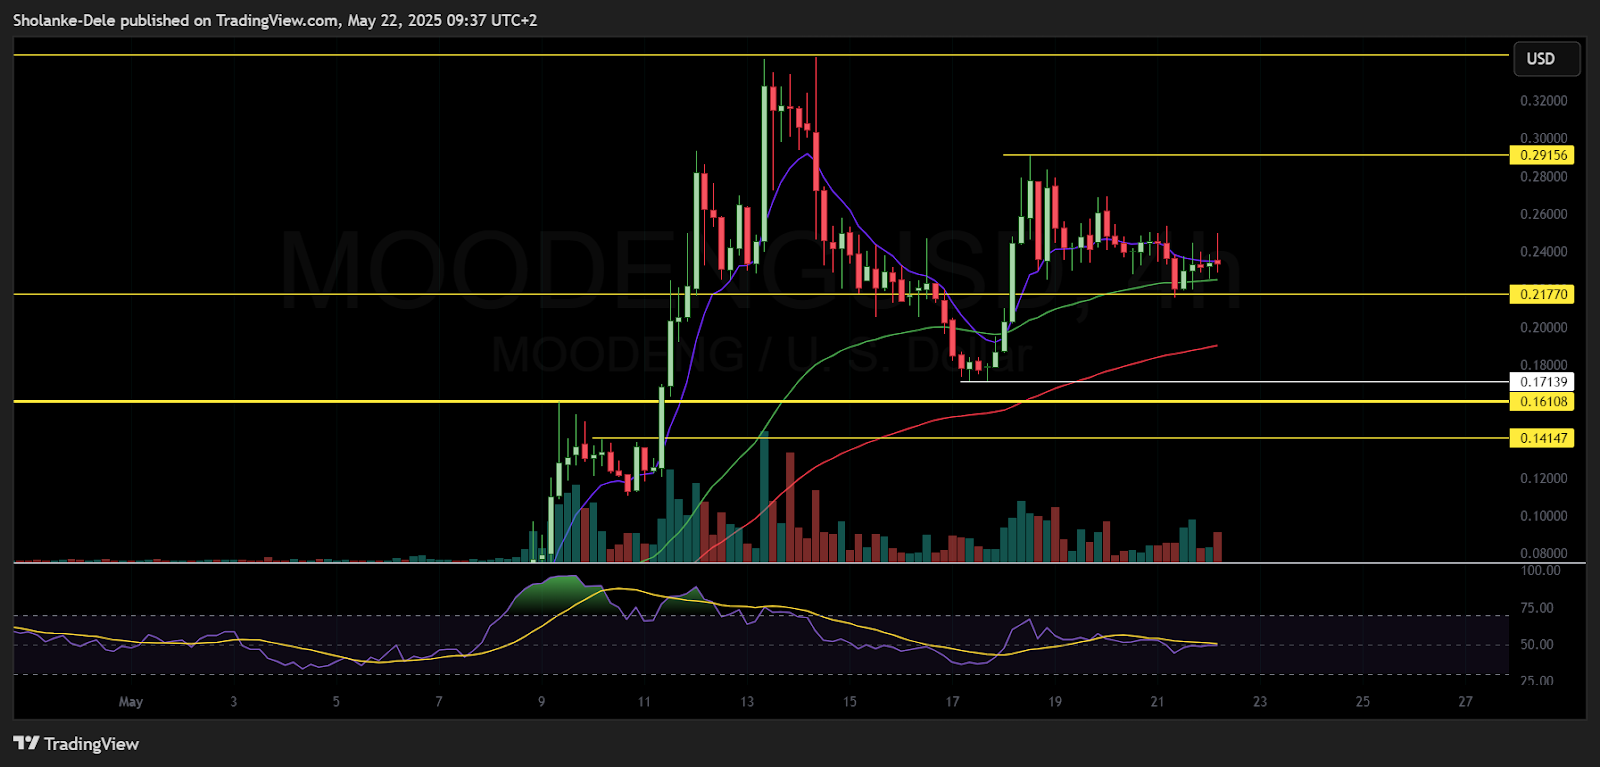
Moodeng price dynamics (May 2025). Source: TradingView
On Thursday, the asset opened at $0.2324 and dipped slightly in the early Asian session. However, a rebound from the 20-day EMA at $0.229 sparked buying interest, driving price to a high at $0.25. As of the European session, Moodeng trades slightly below the intraday-high at $0.2358. The gradual climb from Wednesday’s low to today’s high hints at potential recovery, but the move lacks confirmation.
Moodeng price outlook hinges on 20-day EMA and $0.2177 support defense
A notable development has been the behavior of the 4-hour RSI. Despite Wednesday’s support bounce and today’s recovery attempt, RSI has hovered in the neutral zone, suggesting consolidation rather than a clear shift in momentum. If RSI eventually climbs into bullish territory, it may indicate buying strength that could push price above this week’s earlier highs and toward the buy-side liquidity zone near $0.2915 resistance zone.
Volume trends tell a more cautionary story. Over the past four days, trading volumes have declined consecutively. This signals a lack of conviction among both bulls and bears, reinforcing the notion of consolidation rather than a clear trend reversal.
Looking ahead, the reaction around the 20-day EMA and the key support at $0.2177 will shape Moodeng’s short-term direction. If price breaks below both levels and the 4-hour RSI shifts below 50, selling momentum could drag the altcoin down to test last week’s low at $0.1714, where sell-side liquidity is concentrated.
In summary, while Moodeng has shown early signs of recovery from this week’s selloff, the broader context points to a market still searching for direction. The coming sessions may determine whether current support levels can hold, or whether deeper losses lie ahead.
Moodeng price surged over 50% during the weekend but stalled in a tight range below $0.292. Technical support held near $0.2177 where key EMAs aligned for a possible bullish base


