Moodeng price action contradicts bearish candlestick signal as altcoin retests support
 Moodeng defies bearish setup
Moodeng price made an aggressive move higher on Thursday, defying the widely-recognized Three Black Crows pattern that had defined the first part of the week. The pattern, which reflects a bearish shift in sentiment through three successive down days, appeared to signal a reversal from Moodeng’s prior uptrend. However, the altcoin found support on Wednesday at $0.2177 and mounted a surprise 40% rally by Thursday, climbing from $0.228 to a high of $0.3262.
• Moodeng reversed Three Black Crows pattern after finding midweek support at $0.2177
• Thursday’s 40% rally cleared key resistance and re-energized bullish volume
• Friday’s retracement challenges the $0.2915 support level for bullish continuation
This breakout not only reversed the week’s losses but also cleared two key levels: the previous three-day highs and the resistance at $0.2915. Notably, the move occurred on stronger volume than the volume recorded during the earlier consecutive declines, pointing to renewed bullish interest. The rally may have been supported by a bounce from the 20 EMA and the positive correlation to Bitcoin’s continued strength this week.
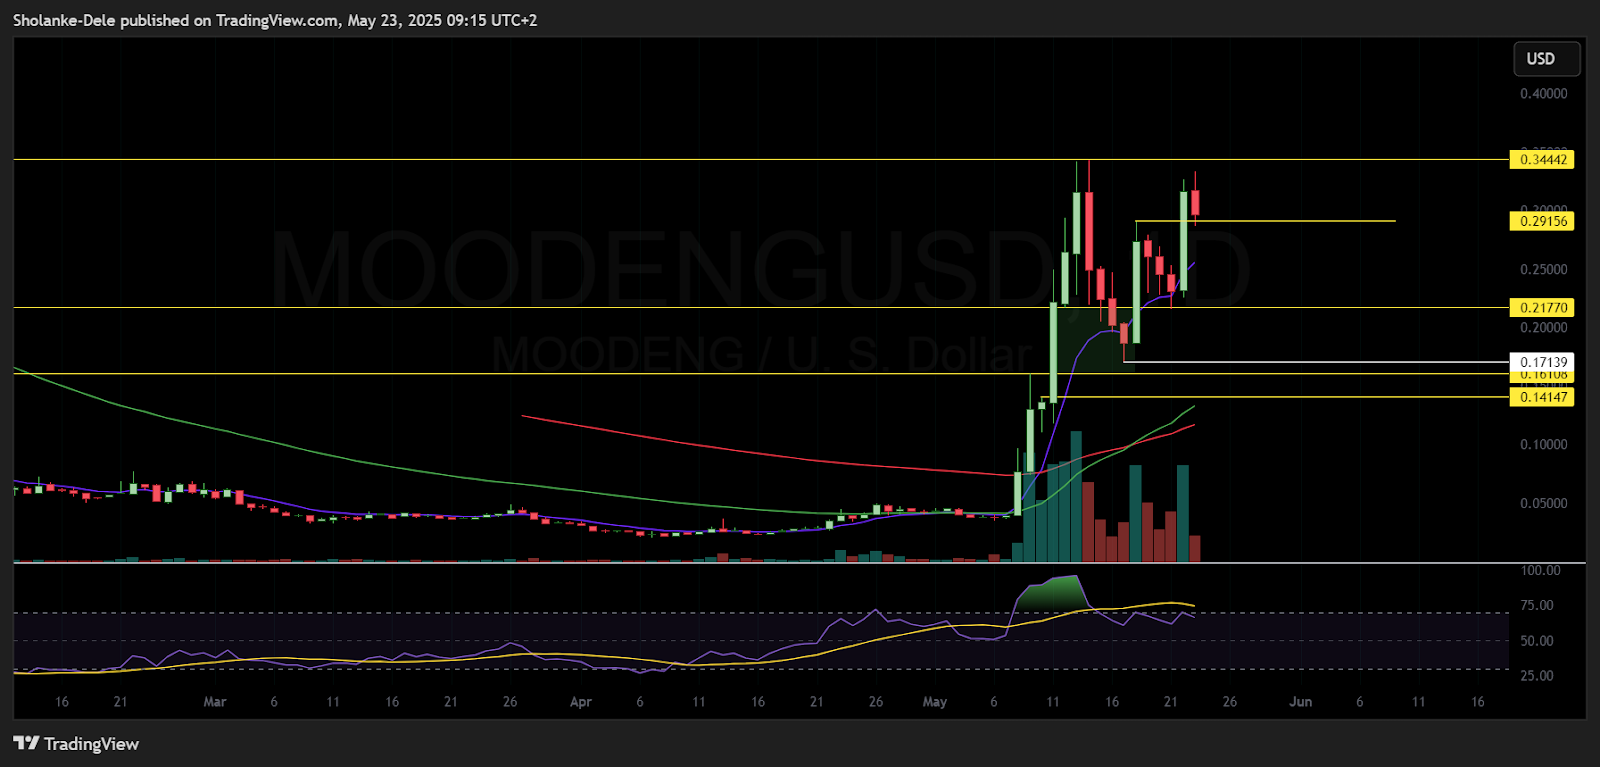
Moodeng price dynamics (April - May 2025). Source: TradingView
However, Friday’s price action tells a different story. After hitting an intraday high of $0.3355 during Asian trading hours, Moodeng slipped into a decline that has erased over 13% of the gains from Thursday. As of the European session, the altcoin is now testing the $0.2915 level, which previously acted as strong resistance and capped a weekend rally. This level now plays a crucial role as potential support.
Moodeng daily RSI exit from overbought territory hints at a healthier uptrend
The ability of Moodeng to hold this area will be critical in determining whether the recent bullish momentum has further room to extend, or if the failed follow-through on Friday signals a deeper retracement. If this support level is lost, the next area of interest lies at the 20 EMA around $0.275, followed by the 50 EMA near $0.239.
Despite Friday’s retracement, the broader weekly picture remains positive. Moodeng is still up 6.7% above the week’s open and sits just 17% below its all-time high of $0.344. Moreover, the daily RSI has cooled from overbought conditions and now sits in bullish territory, indicating that the market is no longer overstretched.
The next few sessions will likely center on whether the bulls can defend the $0.2915 level. A rebound could keep short-term upside targets alive, while a breakdown may open the path for further profit-taking.
Moodeng price bounced from the $0.2177 support but failed to show strong follow-through. RSI stayed neutral and volume dropped, showing weak bullish conviction.


