Bitcoin price coiled structure builds tension after Doji candlestick signals indecision
 Bitcoin stalls near $109K as traders await breakout from tight range
Bitcoin price continues to trade near $109,000 on Wednesday, showing little directional movement during the Asian and European sessions.
Price has also been stuck in a narrowband between $106,800 and the supply zone below $112,000 for the past four trading days. This consolidation reflects a lack of clear momentum as traders await a breakout move from the tight range.
Highlights
-Bitcoin stuck in tight range between $106,800 and $112,000 for four days-Tuesday's failed breakout adds to short-term exhaustion risks-4hr RSI slips below neutral level while daily RSI holds near 65
Although Tuesday's price action offered a short-lived sign of strength after bitcoin briefly broke above Monday’s high of $110,460, however, the rally lost steam quickly, and price reversed to close near $109,000. The failed bullish continuation has added weight to the argument for short-term exhaustion.
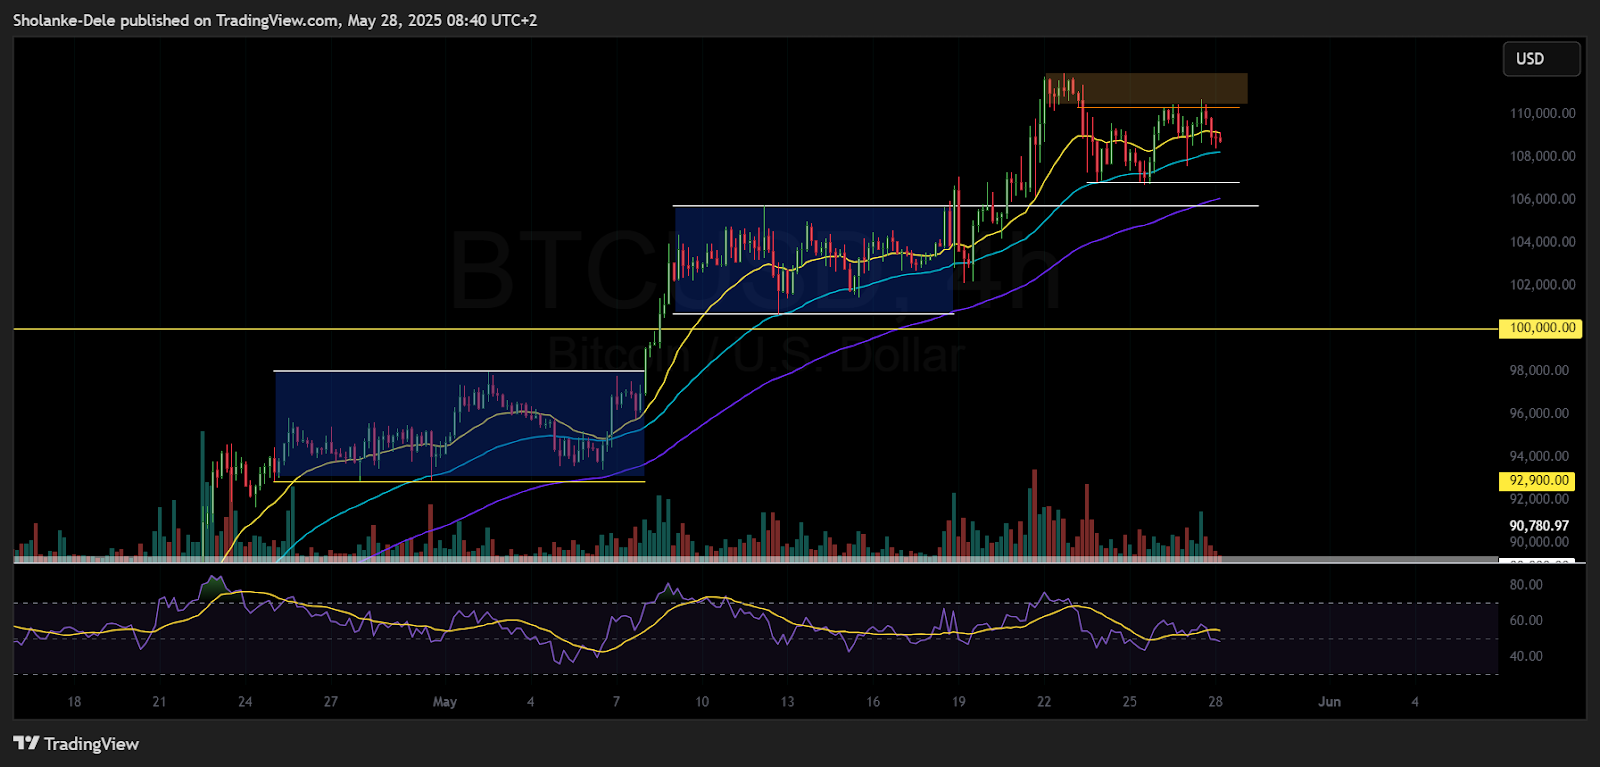
BTC price dynamics (April - May 2025). Source: TradingView
Technically, the 4HR chart reveals bitcoin formation of two consecutive higher highs since the retreat from its all-time high of $112,000. This structure still leans slightly to the upside, but momentum has not followed through. The Doji candlestick formed on Tuesday points to indecision, often a precursor to major directional shifts, especially when seen during periods of low volatility. This aligns with the broader view that bitcoin is in a coiled setup, awaiting a directional push.
Bitcoin open interest softens as leveraged traders reduce exposure
From an indicator perspective, the 4-hour RSI has now dipped below 50, showing a soft bearish tilt in the near term, even though the daily RSI still holds firm around 65. This divergence between timeframes suggests the possibility of a short drawdown before price attempts to resume its upward trajectory.
The 50-exponential moving average on the 4-hour chart, currently near $108,200, is now a key level to watch. A clear move below it could drive price lower toward Tuesday’s low at $107,600. Further weakness may put pressure on the consolidation floor at $106,800.
On the positioning front, funding rates have cooled to near-neutral levels and perpetual futures open interest has declined. This reflects a pullback in aggressive leveraged positioning, especially from retail traders, who typically front-run breakout moves.
In summary, bitcoin’s short-term direction hinges on how it resolves this tight range. A break above the $110,460 zone would confirm bullish continuation, while a slide below $106,800 could open up more room for downside exploration. Until then, the market remains in a holding pattern, weighed by indecision and subdued momentum.
Bitcoin faced strong resistance at $110,300 after pulling back from its all-time high. Long-term accumulation during the dip supported a bullish continuation setup.


