Moodeng drops 10% midweek but RSI and demand zone attract bulls
 Moodeng breaks below weekly lows
Moodeng price is extending its decline today, Wednesday, May 28, after showing clear signs of fatigue earlier in the week. Price has broken below both Tuesday’s low of $0.2513 and Monday’s low of $0.245, marking a fresh three-day low in today’s European session. Moodeng is now down over 5% on the day and roughly 10% for the week.
• Moodeng breaks below prior day lows to hit 3-day low at $0.245
• Bearish momentum strengthens as 4-hour RSI slips under midpoint
• Daily RSI near 58 keeps broader bullish trends still technically valid
The weakness follows a pattern of reduced volatility and fading momentum. On Tuesday, Moodeng traded in a narrow 6% range between $0.267 and $0.251 before closing near its open, forming a daily Doji candlestick. This pattern reflects indecision and often appears before significant moves. The fact that Wednesday opened to the downside gives weight to the bearish shift following the indecision candle.
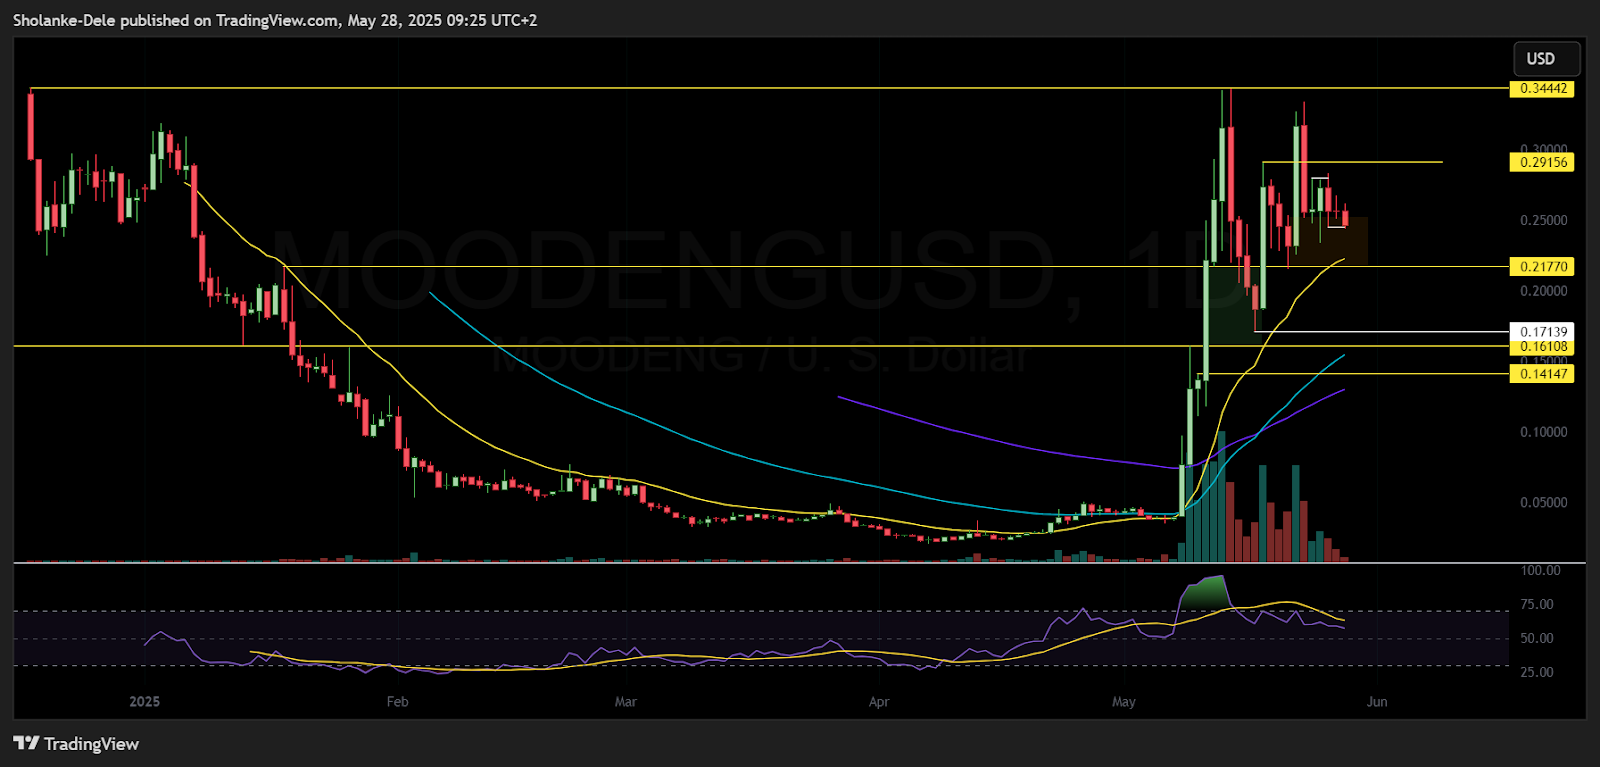
Moodeng price dynamics (Jan 2025 - May 2025). Source: TradingView
Technically, the 4-hour RSI has dropped firmly below the midpoint, showing that momentum has turned bearish on the intraday timeframe. The shift supports the case for further pressure on the downside in the short term.
Moodeng weak volume on recent selloff hints at fragile bearish conviction
Despite this bearish bias, some factors hint at a possible reversal if price reaches stronger technical zones. Volume has been thinning on the recent price decline, which usually signals reduced conviction from sellers. Furthermore, the daily RSI still holds near 58, a level that keeps Moodeng within bullish territory on a broader trend view. There is also a clear demand zone on the daily chart between $0.254 and $0.216. This area may attract buyers and slow down or reverse the ongoing decline.
A midweek recovery could push Moodeng back toward the weekly high at $0.283. That level would need to be reclaimed to shift sentiment back to the upside. Above that, the resistance zone at $0.2915 could serve as the next upside objective if buyers return strongly.
For now, Moodeng trades inside a technical compression where short-term selling pressure clashes with longer-term bullish potential. Traders may watch for signs of strength near the demand area or wait for a break above the previous day’s high to confirm bullish continuation. Until then, momentum favors sellers as today’s price action extends below prior session lows.
Moodeng price bounced from the $0.225 demand zone after a structure shift signalled upside potential. The move followed Bitcoin’s retracement which shaped Moodeng’s similar technical pattern.


