Solana price struggles to break above $177 resistance after consolidating near $174
 Solana price action consolidates near $174, with key resistance at $177–$178
Solana (SOL) continues to show consolidation near the $174 mark after several attempts at pushing higher. The recent price action reflects indecision, with SOL hovering near the confluence of the 20 EMA and the midline of the Bollinger Bands on the 4-hour chart.
Highlights
- Solana stabilizes near $174 after failing to break through the $177–$178 resistance zone.
- Price action shows consolidation with support near $173.50–$173.20.
- A break above $178 could lead to further upside, while a drop below $171 would target $165–$160.
This suggests a neutral-to-weak near-term bias, as both the 50 and 100 EMAs have flattened out around $174.57 and $171.30, signaling a lack of clear directional momentum.
Short-term analysis points to mixed momentum
On the 30-minute chart, Solana’s price has broken down from an ascending trendline and is testing key support near $173.50–$173.20. The repeated failure to break above the $177.50–$178 resistance range has created a local ceiling, while the RSI on the 30-minute chart sits at 38.79, indicating a mild bearish divergence. The MACD is crossing below the signal line, reinforcing the short-term bearish outlook. However, the stochastic RSI is approaching oversold levels, suggesting potential exhaustion and a possible relief rally if support holds.
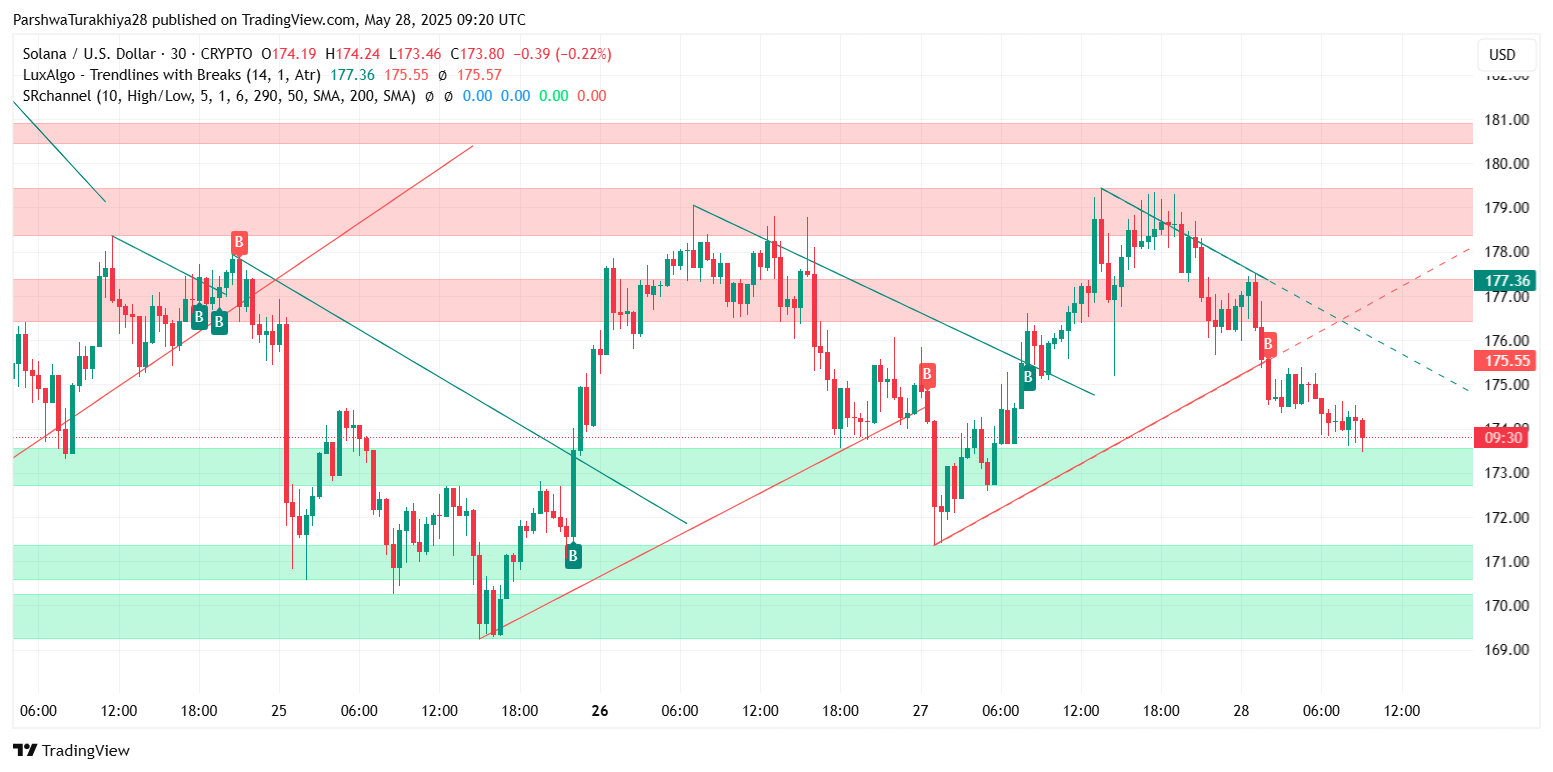
Solana price forecast (Source: TradingView)
On the daily chart, Solana remains within a broad support-resistance range between $160 and $180. Despite several attempts, the price has been unable to breach the $177–$178 resistance zone, with the 0.382 Fibonacci level at $177.65 acting as a significant barrier. The asset’s recent price action suggests a distribution pattern may be forming, unless a breakout above $178 occurs. A breakdown below the support at $171 could trigger a deeper correction, potentially targeting the $165–$160 range.
Medium-term outlook: Key support and resistance levels to watch
Solana's broader medium-term trend remains neutral-to-bullish, as the asset continues to hold above significant support levels. However, the recent consolidation and failure to break key resistance levels raise concerns about a potential shift in momentum. A decisive break above $178, supported by volume, could open the door for a move toward $188–$195, signaling a continuation of the bullish trend. On the downside, failure to hold above $171 would expose the $165–$160 support region, where further downside risks would materialize.
Solana’s price action remains range-bound within critical support and resistance zones. Traders will be watching for a breakout above $178 or a drop below $171 to define the next major move for SOL.
As discussed previously, Solana’s recent range-bound price action suggests that the coin is in a consolidation phase. Traders are looking for a break above $178 to continue the bullish trend, while a failure to hold support at $171 would likely lead to a deeper correction. The broader trend remains neutral-to-bullish, with the $160–$180 support-resistance box continuing to define the near-term outlook for SOL.


