Pepe price remains range-bound as key levels hold steady
 PEPE consolidates within a symmetrical triangle pattern, with key resistance at $0.00001440
Pepe (PEPE) has shown resilience above the $0.00001300 support level following a strong surge earlier in May. The cryptocurrency has been consolidating within a narrowing symmetrical triangle pattern on the 4-hour chart, reflecting a compression in volatility.
Highlights
- PEPE stabilizes at $0.00001370 after pulling back from the $0.00001440 resistance.
- The coin is consolidating in a symmetrical triangle pattern, with key support at $0.00001300.
- A breakout above $0.00001440 could signal further upside toward $0.00001587 and higher.
Currently trading at around $0.00001370, PEPE is encountering immediate resistance near $0.00001440. Support remains firm between $0.00001300 and $0.00001275, and this narrowing price action suggests that traders are awaiting confirmation of the next major directional move.
Bullish structure remains intact despite near-term weakness
The rally from April lows around $0.00000720 to recent highs near $0.00001600 remains intact, although PEPE has struggled to break and hold above the $0.00001550–$0.00001600 resistance range. On the daily chart, PEPE continues to hold above a previously descending trendline, which now serves as support. Despite this, the cryptocurrency is currently consolidating, and any breakdown below $0.00001275 could lead to a deeper retracement, potentially testing the $0.00001050–$0.00000980 demand region.
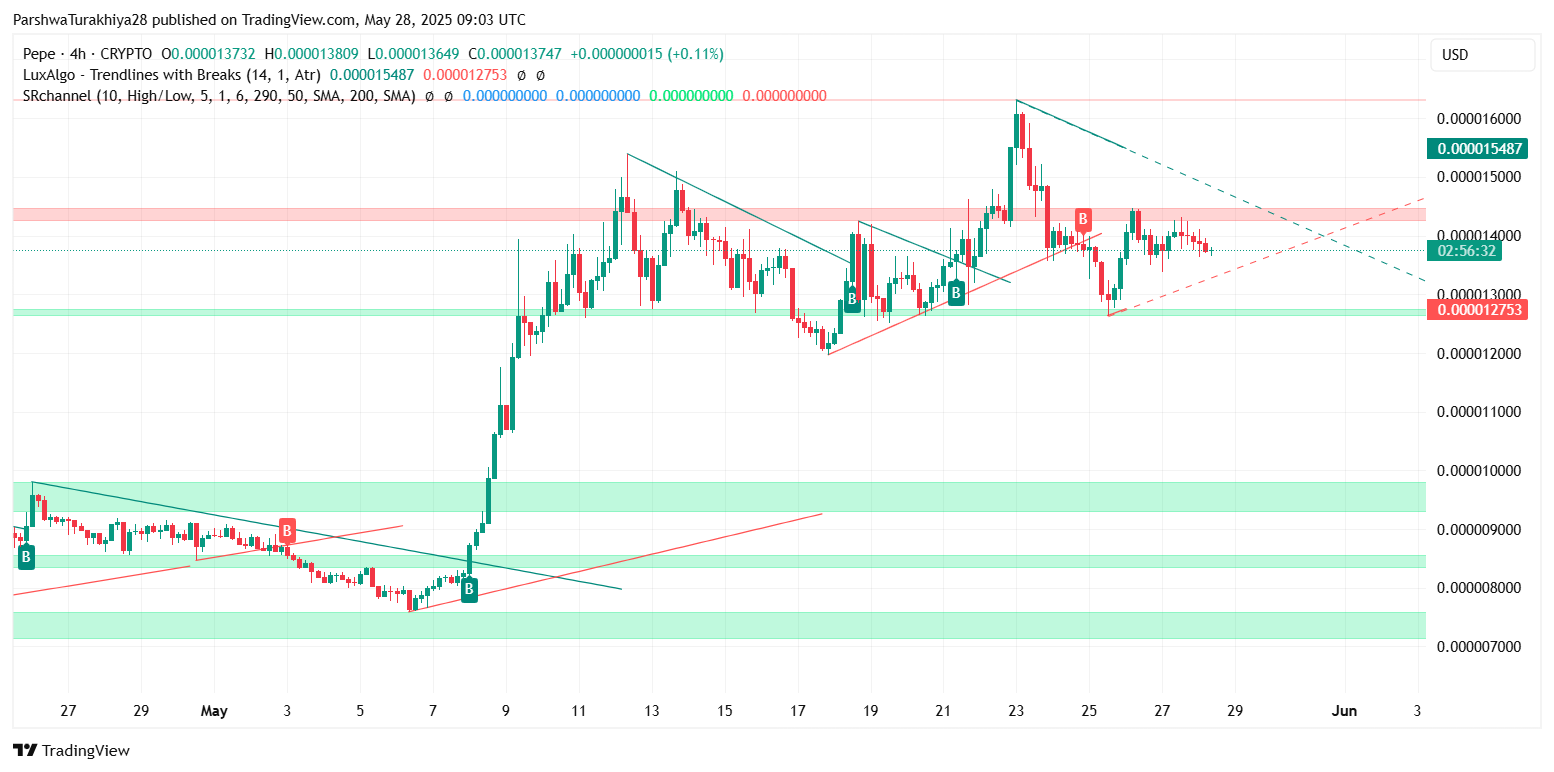
PEPE/USD price forecast (Source: TradingView)
Momentum indicators suggest near-term bearish pressure. The RSI has formed a bearish divergence, and it currently sits at 40, indicating weakening bullish momentum. Additionally, the MACD has crossed below the signal line and remains in negative territory, reinforcing the short-term correction narrative. However, the Stochastic RSI is nearing oversold territory, suggesting that a bounce could emerge if price tests the lower support band near $0.00001275.
Key resistance levels and potential breakout triggers
On the weekly chart, PEPE has stalled at the 0.382 Fibonacci retracement level of the full November-to-March decline, around $0.00001480. A decisive break above this level would open the door for further upside toward the 0.5 and 0.618 Fibonacci levels at $0.00001770 and $0.00002050, respectively. The broader bullish structure remains intact, with higher lows on the weekly timeframe suggesting ongoing accumulation despite the near-term consolidation.
In conclusion, PEPE remains range-bound within a critical decision zone. A breakout above $0.00001440–$0.00001480 could signal a continuation of the uptrend, with potential targets at $0.00001587 and beyond. On the downside, a breakdown below $0.00001275 would risk triggering a deeper pullback toward the $0.00001050–$0.00000980 region. Short-term momentum is currently tilting bearish, but the broader trend support remains solid unless breached.
As previously discussed, PEPE has remained within a bullish structural pattern despite short-term corrective action. If it can hold above critical support levels, the bullish trend is likely to continue, with key targets at $0.00001587 and $0.00001770. A failure to maintain support could trigger deeper retracement toward $0.00001050.


