Shiba Inu price consolidates near $0.00001430 as breakout momentum builds
 Shiba Inu consolidates in a symmetrical triangle pattern, with key support at $0.00001399
Shiba Inu (SHIB) is currently consolidating within a symmetrical triangle pattern on the daily chart, with price action caught between ascending support from early May and descending resistance from the recent rejection near $0.00001749. The token has formed a tight range around $0.00001430, aligning with the 0.5 Fibonacci retracement level from the March–April rally.
Highlights
- Shiba Inu consolidates near $0.00001430, with a potential breakout above $0.00001550.
- The 4-hour chart shows the token facing resistance near $0.00001557, with support at $0.00001399.
- Momentum indicators show mild bullish signals, but the broader trend remains neutral.
On the 4-hour timeframe, SHIB is trading just below a cluster of lower highs forming a descending resistance line near $0.00001557. Price is holding above the $0.00001399 support zone, where a series of intraday wicks indicate demand absorption.
Despite this, the overall price action shows a loss of momentum compared to the May 13 rally, and the token continues to face supply pressure on each approach to resistance. The short-term bias remains neutral, with key levels at $0.00001550 on the upside and $0.00001380 on the downside.
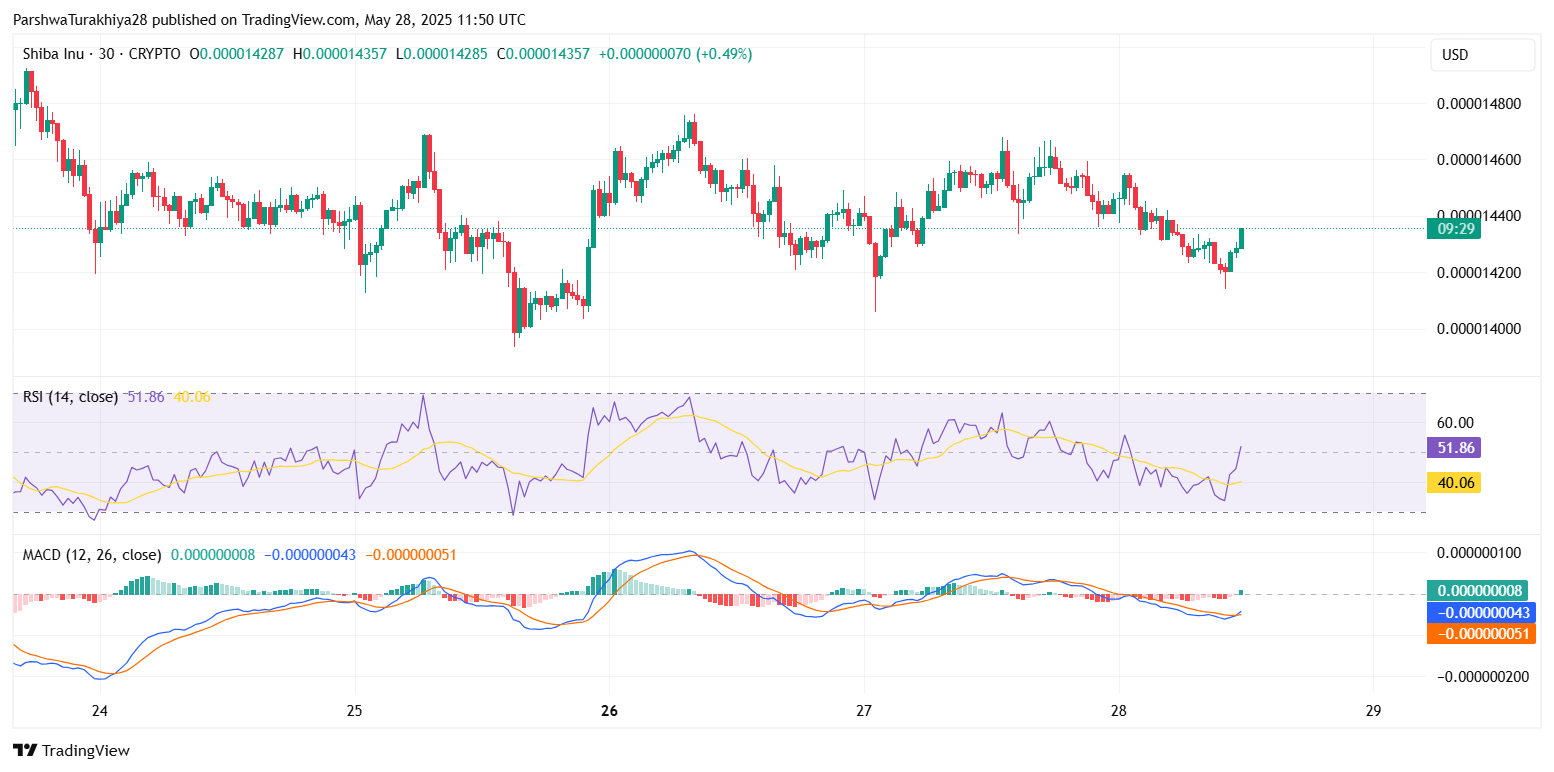
Shiba Inu price dynamics (Source: TradingView)
Looking at the 30-minute chart, SHIB bounced off intraday demand near $0.00001420 and is attempting to reclaim the $0.00001450 level, which previously acted as a breakdown region. The RSI is recovering above 50, currently at 51.86, and the MACD is turning positive with a minor crossover, indicating a short-term attempt to regain momentum. The Stochastic RSI has also crossed above 80, suggesting that SHIB is seeing an intraday rebound. However, without a clean break above resistance, the bullish momentum may remain limited.
Fibonacci levels suggest potential breakout targets
The daily Fibonacci retracement chart reveals key levels to monitor. The 0.382 level at $0.00001483 and the 0.236 level at $0.00001590 remain upside targets if the bulls regain control. On the downside, a break below the 0.618 retracement near $0.00001309 could open the door for a deeper retracement toward the 0.786 level near $0.00001200, which aligns with a previous accumulation zone from April.
Overall, Shiba Inu price action remains range-bound, with a slight bullish bias above $0.00001390. A decisive breakout above $0.00001550 could open up room toward $0.00001749 and beyond. Conversely, failure to hold the $0.00001390–$0.00001400 base could trigger a retest of lower support around $0.00001225 or even lower toward the Fibonacci 0.786 support.
As previously noted, Shiba Inu remains range-bound within a critical decision zone. The next major move depends on a breakout above $0.00001550 or a failure to hold support at $0.00001390. Traders should keep an eye on these key levels for confirmation of the next directional shift.


