PEPE price explodes past $0.000014 with strong upward trend
 PEPE tests resistance at $0.00001456, with strong support at $0.00001380–$0.00001400
Pepe (PEPE) has recently broken out above the $0.00001400 resistance zone, confirming a bullish structure. The price briefly tested highs around $0.00001511 following the breakout, showing strong momentum after multiple higher lows since May 24.
Highlights
- PEPE breaks above $0.00001400, testing highs around $0.00001511.
- The token remains supported by demand at $0.00001380–$0.00001400.
- A break above $0.00001528 could push PEPE towards $0.00001650, with potential for a yearly high retest.
The consolidation range between $0.00001380 and $0.00001400 now serves as a crucial support zone, which has turned prior resistance into demand. Traders are watching this range closely, as the next directional move could depend on whether support holds or the price moves higher.
Bullish continuation supported by Fibonacci retracement and Ichimoku Cloud
On the daily chart, PEPE continues to show bullish momentum after a sharp rally in early May. Price has successfully reclaimed the 0.5 Fibonacci retracement level from the November 2024 to March 2025 decline and is working to establish a base above this level. Market sentiment remains skewed toward accumulation, with the rounded higher low near $0.00001294 further reinforcing this view. On the weekly chart, PEPE is trending upward, eyeing the golden ratio zone near $0.00001890, as it holds above mid-range Fibonacci levels.
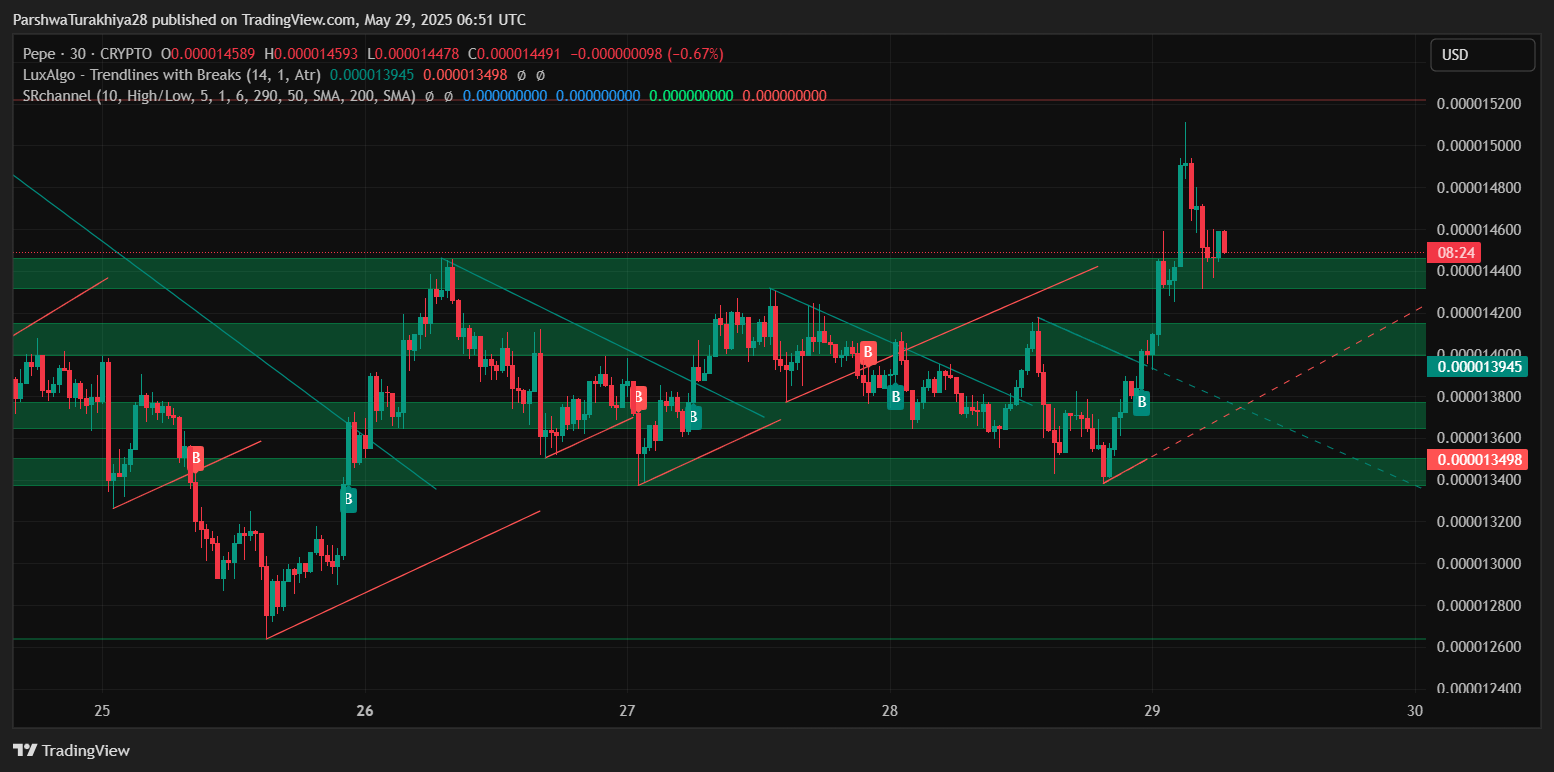
PEPE price dynamics (Source: TradingView)
The 30-minute chart reveals PEPE retesting its breakout structure, with strong green candles breaking above the $0.00001460 resistance. While mild rejection followed the breakout, the higher lows and expanding bullish structure indicate strong buyer interest. The RSI has moved toward 58.28, indicating positive short-term momentum, and the MACD histogram remains in positive territory, reinforcing upward pressure. The Ichimoku Cloud continues to support this bullish momentum, with price trading above both the Tenkan-sen and Kijun-sen lines, providing a strong cushion near $0.00001420.
Support and resistance levels to monitor in the short term
On the 4-hour chart, PEPE’s Bollinger Bands are widening, with the price testing the upper band near $0.00001456. The 20 EMA is aligned upward around $0.00001396, offering dynamic support alongside the 50 EMA at $0.00001383. This alignment suggests that bullish control is intact, as long as PEPE remains above these key support levels. A clean break above $0.00001528 could propel the token toward $0.00001650 and potentially retest the yearly high. However, failure to maintain support at $0.00001350 could lead to a pullback toward the $0.00001290 zone.
PEPE’s technical structure indicates continued bullish momentum as long as the $0.00001380–$0.00001400 support zone holds. Traders are eyeing the $0.00001528 level as a potential breakout point that could pave the way for a move toward $0.00001650 and beyond.
As previously discussed, PEPE’s price action remains bullish as long as support near $0.00001380–$0.00001400 holds. A break above the $0.00001528 resistance could open the door for further gains, with targets at $0.00001650 and a retest of the yearly high. However, failure to hold support could lead to a deeper pullback toward the $0.00001290 region.


