Moodeng price stalls below $0.20 as flag pattern holds token in tight consolidation
 Moodeng trades around $0.1825 as price consolidates below $0.20 resistance
Moodeng cryptocurrency has staged a strong recovery since late June after suffering multiweek declines.
The rebound continued momentum in early July, driving the price from a low at $0.133 to a peak at $0.239 late last week. This sharp bounce signalled renewed trader interest in the memecoin and sparked hopes for a sustained rally.
Highlights
-Moodeng trades around $0.1825 after a 5% daily drop
-Price action remains trapped in a flag pattern between $0.18 and $0.20
-Traders await breakout as EMAs and Fibonacci levels form short-term support
However, momentum started to cool near the end of last week. After the strong run-up, Moodeng stabilized at the Fibonacci 61.8 golden ratio of the early July rally, a level that coincided neatly with a support zone around $0.17. This area proved to be a solid base, helping the memecoin log its second consecutive bullish week and setting the stage for further upside potential.
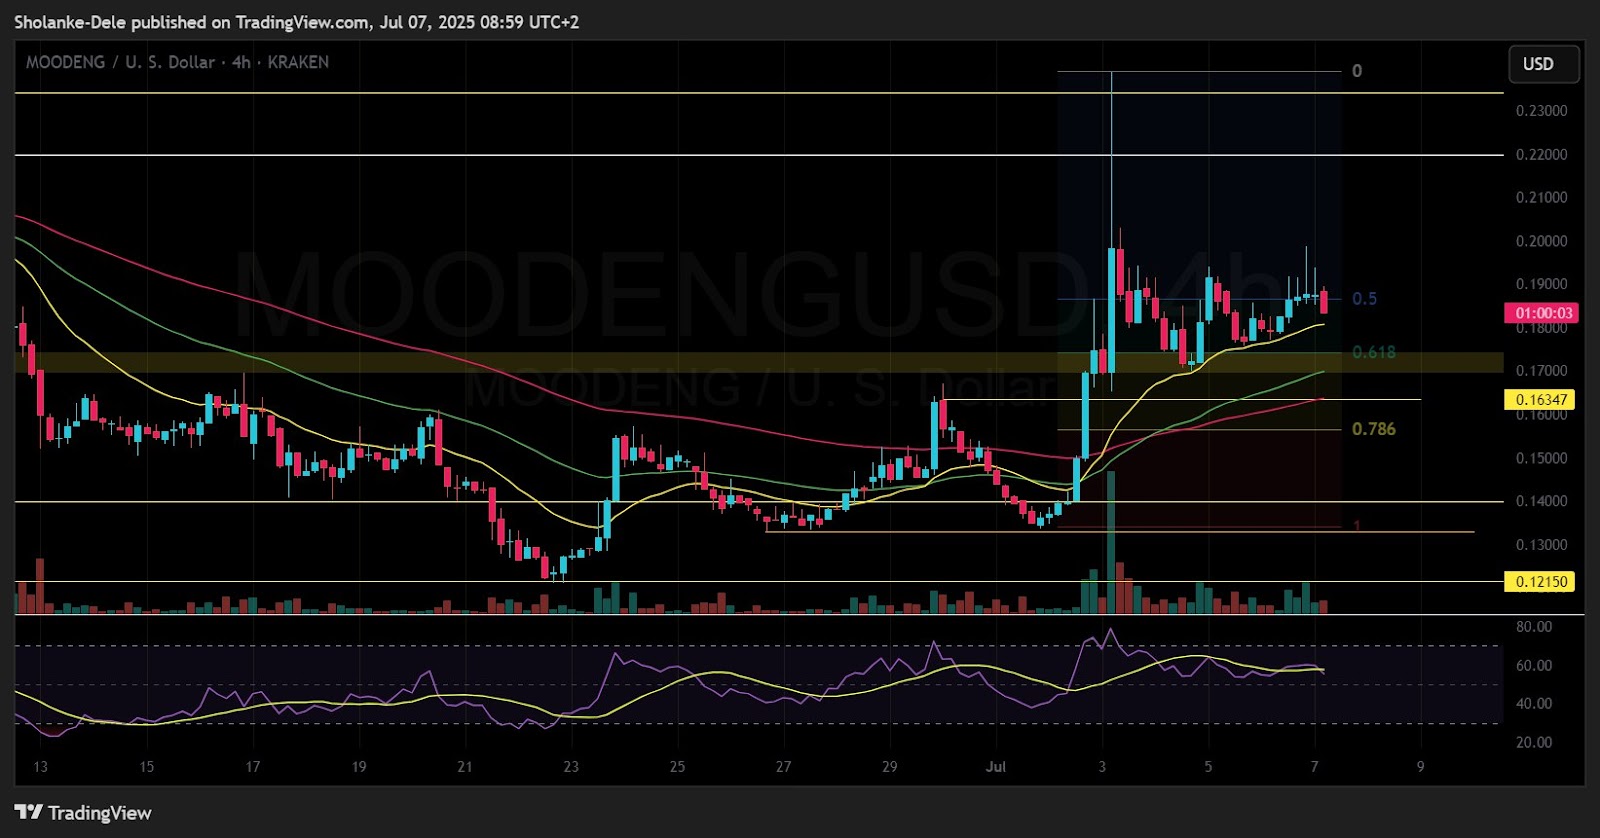
Moodeng price dynamics (June - July 2025). Source: TradingView
Throughout the weekend, Moodeng managed to notch new intraday highs, reflecting an effort by buyers to maintain control. Even so, price action has stayed trapped inside a tight consolidation range, forming what is technically known as a flag pattern. This structure has kept the price below the $0.20 psychological resistance level. The lower boundary of this flag is supported by the 50 and 100 exponential moving averages on the 1-hour chart, suggesting a robust foundation in the short term.
Moodeng holds above 20 EMA as $0.18 emerges as critical support
As of Monday, July 7, Moodeng price is facing an intraday decline, trading around $0.1825 during the European session. This translates to a daily loss of over 5%, although it still holds a strong month-to-date gain of 25%. This contrast highlights the ongoing tug between short-term profit-taking and broader bullish sentiment.
The 20 EMA on the 4-hour chart sits around $0.18, providing additional support in the near term. If this level holds, it could encourage a move toward a higher high above the critical $0.20 resistance, potentially unlocking further upward momentum. Conversely, a break below $0.18 would signal a breach of the flag pattern’s lower boundary and open the door to a deeper retracement this week.
Traders now look for a decisive move either above $0.20 or below $0.18 to determine the next major direction. A confirmed push higher would reinforce the broader recovery trend that started in late June, while a slip below support could suggest that Moodeng needs more time to consolidate before another advance. For now, the market waits to see which force will take the lead.
Moodeng surged in early July on strong volume and optimism before losing all gains. Price bounced near 61.8% Fibonacci and 50 EMA showing a possible recovery.


