Uniswap faces market pressure as whale activity increases
 UNI sees large whale sell-offs amid market volatility
Uniswap (UNI) is navigating heightened market activity as institutional investors strategically offload large volumes of UNI tokens. Over the past three days, significant deposits have been made to multiple exchanges, signaling profit-taking moves during a volatile market phase.
Despite this, the token continues to maintain positive momentum, with experts remaining cautiously optimistic about its outlook.
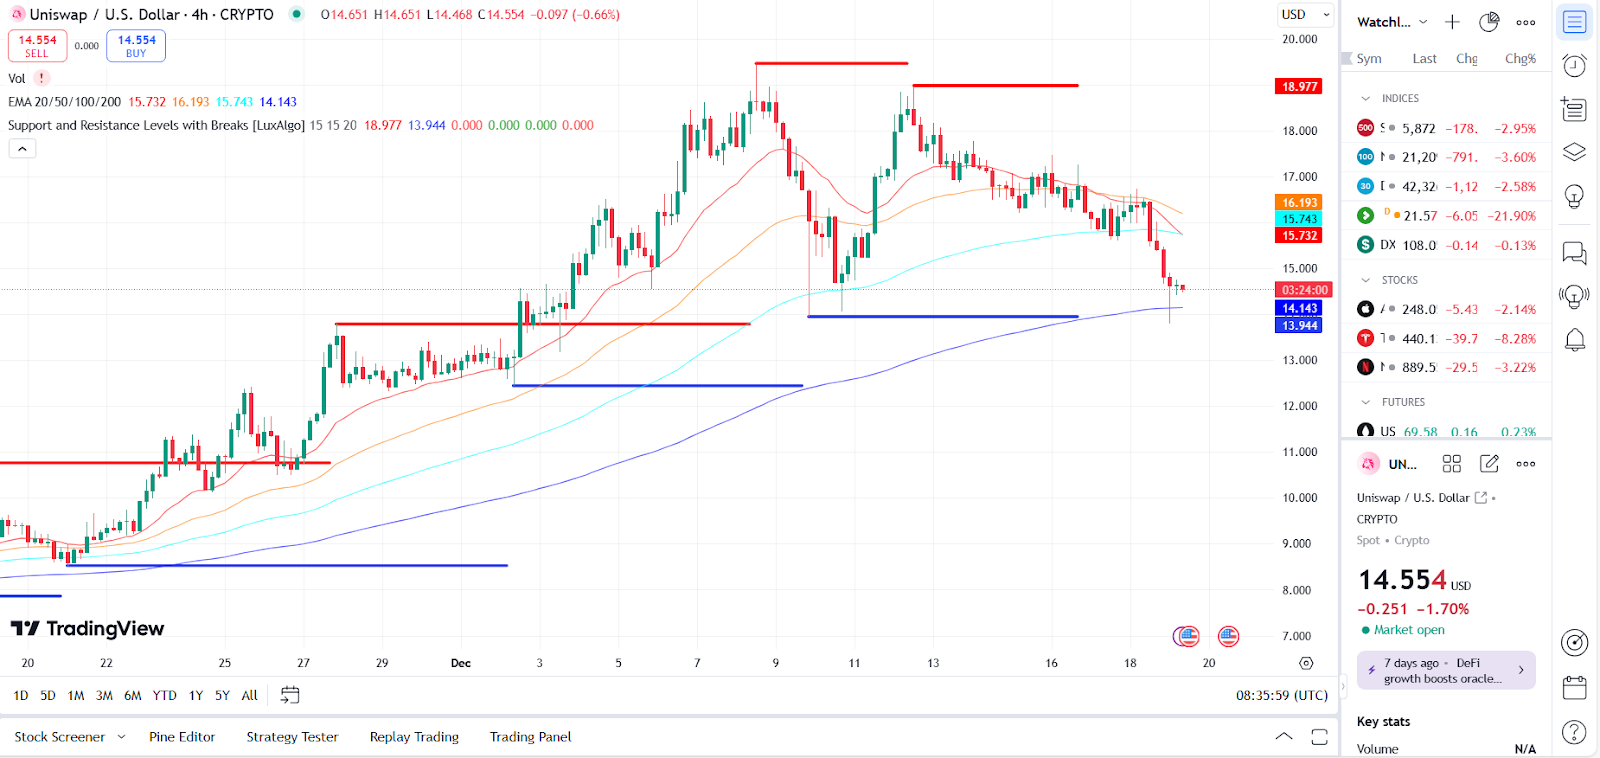
Uniswap chart ( Nov 2024 - Dec 2024) Source: Trading View
Institutional whale activities trigger market shifts
In a striking development, the whale identified as “0x59A” deposited 1.495 million UNI tokens worth $89.4 million on Binance. The move secured a profit of $13.7 million, reflecting an impressive 129% return within five months. Similarly, a wallet linked to the Uniswap team, “0x837,” deposited 5 million UNI tokens worth $80.97 million on Coinbase Prime.
Notably, this wallet had been dormant for over four years before executing this transaction, a move interpreted as strategic given the current market conditions. Following the deposit, the wallet still holds $65.7 million worth of UNI tokens, emphasizing its ongoing influence on market dynamics.
UNI shows resilience during market correction
Despite heavy offloading by whales, UNI has shown resilience. Analysts note that for Uniswap to sustain a bullish trajectory, the token must breach the key resistance level at $19.45, also referred to as the R1 pivot level. This target remains critical for broader market confidence, especially as other DeFi tokens like Polkadot (DOT) struggle to rally.
Uniswap (UNI) is trading at $14.55, reflecting a downward trend. The 4-hour chart highlights key resistance at $15.74 and $16.19, with further significant resistance at $18.97. The 200 EMA at $14.14 currently acts as a key support level, alongside a lower support zone at $13.94.
A sustained break below $14.14 could expose UNI to further declines, targeting the next support at $13.94. Conversely, a rebound above $15.74 and $16.19 is necessary to regain bullish momentum and test the $18.97 resistance zone. Technical indicators suggest continued bearish pressure in the short term, but a bounce near the 200 EMA could offer a potential recovery opportunity.


