Moodeng price extends consolidation for sixth day as sellers eye liquidity gap
 Moodeng holds inside six-day range as breakout tension grows
Moodeng cryptocurrency has entered its sixth day inside a defined range between $0.1990 and $0.1700, echoing the broader sideways behavior seen in Bitcoin.
Today, Wednesday, July 9, the cryptocurrency trades close to $0.1763 in the European session after a modest slide during Asian hours. The initial drop from an intraday high at $0.180 to the low at $0.1763 reflects the overall muted volatility that has dominated this week.
Highlights
-Moodeng extends consolidation in six-day range as traders await breakout
-Golden cross on daily EMAs supports longer-term bullish bias despite weekly losses
-4-day low at $0.1718 signals sellers still hold slight control despite muted RSI
The past five days have already shaped a tight consolidation band, and market participants are becoming increasingly focused on whether this pattern will finally resolve. Despite today’s marginal decline of just over 1%, Moodeng shows a weekly loss of over 5%, suggesting that sellers have held a slight advantage since the start of the week. This weakness gained attention after Moodeng touched a four-day low at $0.1718 on Tuesday. The dip, however, was cushioned by the 50 EMA on the 4-hour chart, preventing a steeper slide.
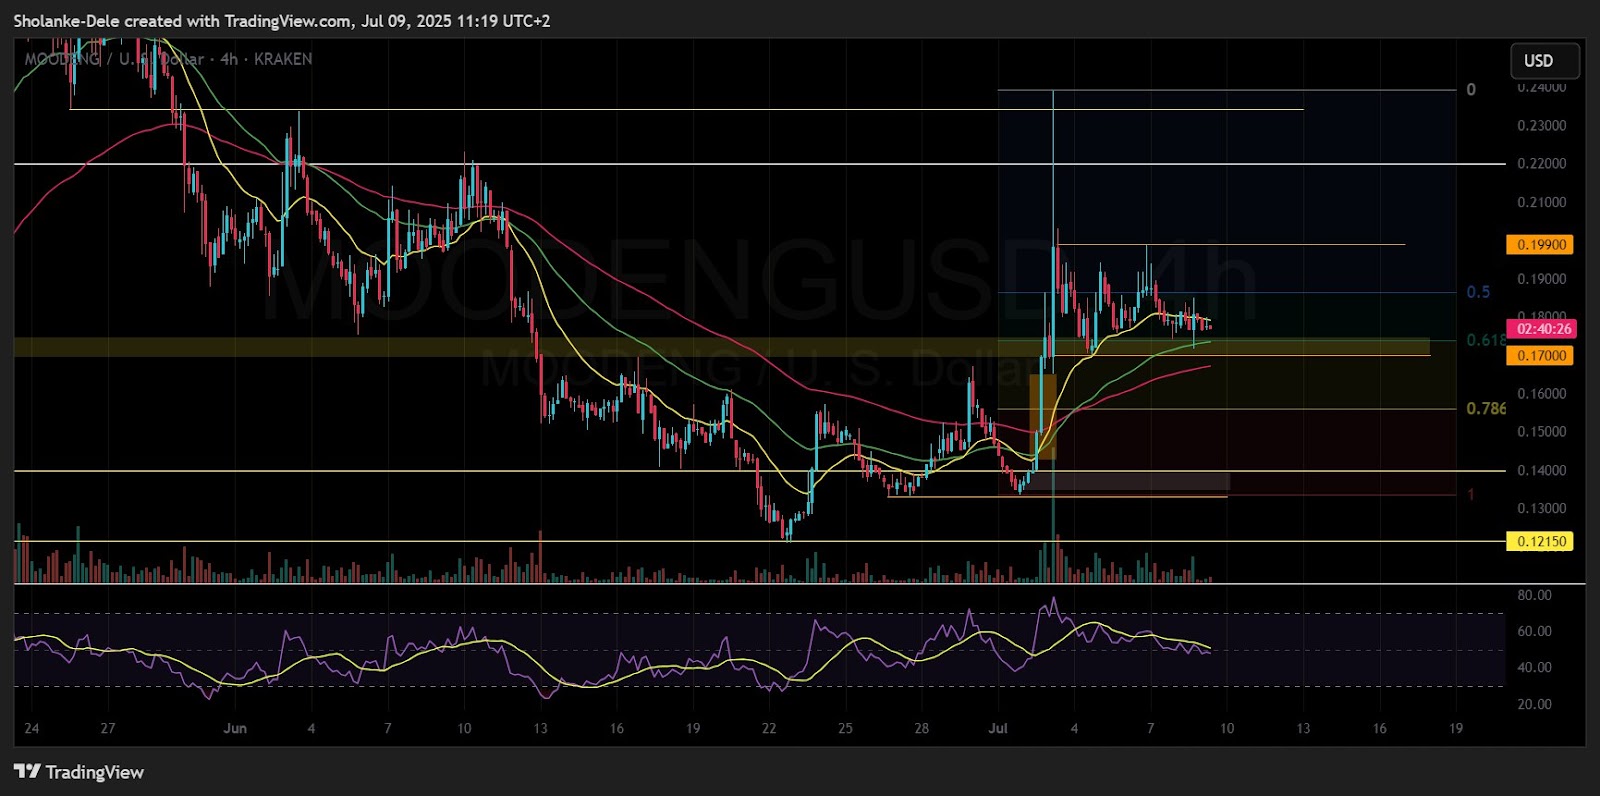
Moodeng price dynamics (June - July 2025). Source: TradingView
From a broader technical perspective, the consolidation sits on the important 61.8% Fibonacci retracement level of the earlier July rally. This suggests that the market is balancing between profit-taking pressure and underlying bullish sentiment. While short-term signals point to hesitation, the longer-term technical outlook leans bullish due to the golden cross between the 20-day and 50-day EMAs. This cross indicates that the general trend structure still favors higher prices in the future.
Moodeng balanced by EMA golden cross and Fibonacci support amid downside risk
However, the possible threat of deeper retracement remains. Since this week has tilted bearish, the draw on liquidity to the downside highlights a potential move toward buy-side inefficiency levels from early July, located between $0.1650 and $0.1430. Rebalancing this inefficiency would likely require Moodeng to test even deeper levels, possibly approaching the 78.6% Fibonacci retracement. This risk scenario explains why traders remain on high alert for a move lower than the current six-day range.
Meanwhile, the 4-hour RSI hovers in neutral territory, suggesting that price may stay contained today unless an unexpected catalyst emerges. Traders will look closely at whether Moodeng can break above the range top to continue its rally, or whether further selling pressure will force a decisive shift lower.
Until a clear move unfolds, Moodeng holds its position between bullish longer-term signals and short-term vulnerability, making the next breakout critical in shaping sentiment for the rest of July.
Moodeng dropped early in the week after new US tariffs hurt global risk sentiment. Price later climbed above $0.1746 and key EMAs as RSI turned supportive.


