Chainlink price analysis: Key levels signal breakout
 Chainlink price analysis hints at breakout
Chainlink (LINK) is trading at $24.655, showing signs of consolidation as technical indicators hint at a potential breakout. Key support levels, resistance zones, and trendline analysis from multiple time frames suggest that LINK's price action could lead to significant movements in the coming sessions.
From a long-term perspective, LINK's weekly chart highlights strong support at $22.870, with additional support at $17.525. Resistance stands at $30.801, with further upside possible at $36.000. Fibonacci retracement levels place $30.801 at the 50% level, marking a crucial barrier, while $36.000 aligns with the 61.8% retracement level, signaling significant resistance.
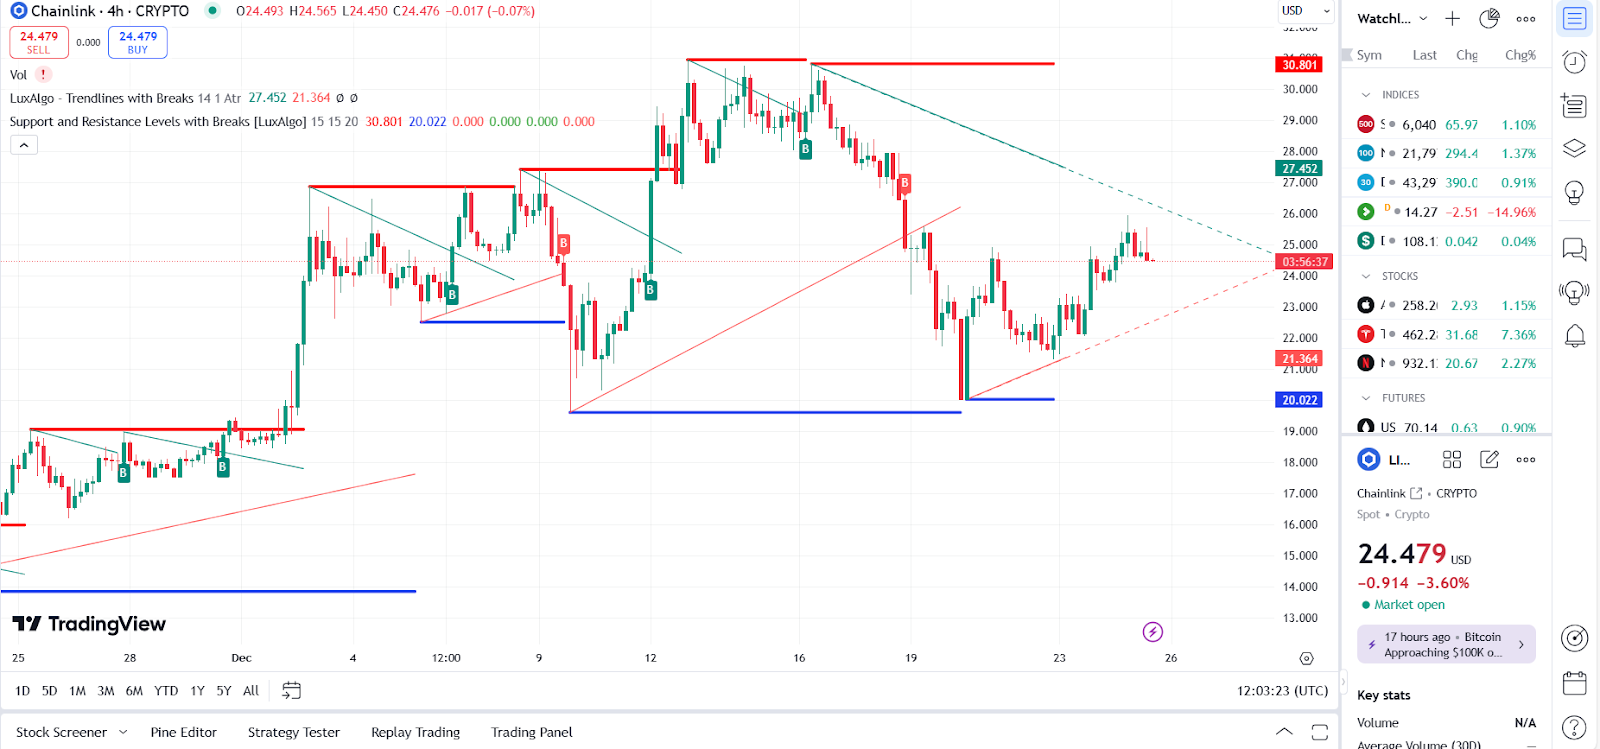
LINK price dynamics (Nov 2024 - Dec 2024) Source: TradingView.
Symmetrical triangle indicates breakout potential
The daily chart reveals a symmetrical triangle formation, suggesting market indecision. Immediate support aligns with $20.022, the triangle's lower boundary, while key resistance lies at $27.533. Bollinger Bands suggest price compression, indicating a potential breakout in either direction. The RSI is neutral, providing room for further movement.
A breakout above $27.533 could set the stage for LINK to target $30.801 and beyond, with sustained bullish momentum potentially pushing prices higher.
On the 4-hour chart, LINK is holding immediate support at $24.392 (50 EMA) and $23.999 (100 EMA). Below this, a critical support level at $21.280 represents a stronger floor, marked by prior lows. Immediate resistance is at $27.533, aligning with recent highs and a descending trendline. A breakout above this resistance could open the path to $30.801, a psychological barrier with historical significance.
Volume analysis shows moderate participation, signaling caution among market participants. A surge in volume is essential to validate a breakout, with the price consolidating between the 50 and 100 EMA. The 200 EMA at $22.671 serves as another key support level, strengthening the bullish case if breached.
Previously, we analyzed the impact of Chainlink’s regular token unlocking process and its influence on price stability, providing valuable context for the current market dynamics.


