Ethereum price tests key resistance as consolidation continues
 Ethereum consolidates near $3,346 as it tests critical resistance levels
Ethereum (ETH/USD) is trading near $3,346, consolidating within a descending channel on the 4-hour chart. The cryptocurrency is at a pivotal point, with its price testing critical resistance levels.
Traders are advised to monitor volume and EMA levels to confirm the price direction. With Ethereum consolidating in a tight range, its next significant move will depend on whether it can overcome resistance or hold key support levels.
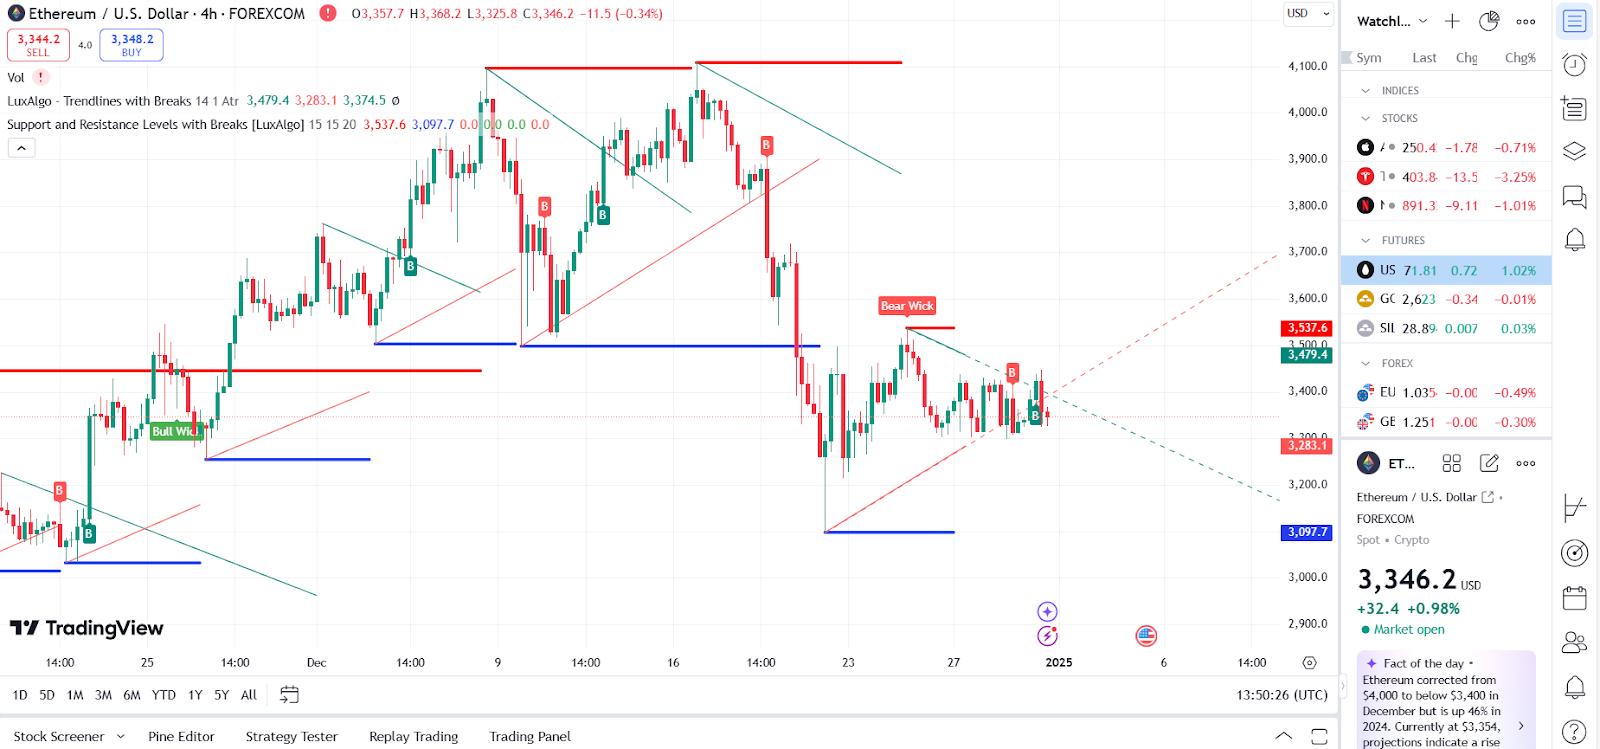
ETH price dynamics (Dec 2024 - Jan 2025) Source: TradingView.
Key resistance and support levels
Ethereum’s immediate resistance is at $3,374, aligned with the 20-day EMA and the descending trendline. A successful breakout above this level could signal bullish momentum, pushing prices toward $3,479 and further to the 200 EMA at $3,518. On the downside, the price is supported at $3,283, with a potential drop to $3,097 if this level is breached. The psychological support at $3,000 remains a critical threshold for buyers.
The technical indicators show a mixed bias. The price remains below the 50 EMA and 200 EMA, indicating bearish medium-term momentum. However, the 20 EMA at the resistance level highlights a possible shift if prices break higher. Declining trading volumes near support reflect caution among market participants.
The chart reveals a descending triangle pattern, marked by lower highs and stable support. If Ethereum’s price breaks above $3,374 with strong volume, it could target the $3,600 range. Alternatively, failure to hold above $3,283 may lead to further losses, reinforcing a bearish outlook.
In our previous analysis, we discussed Ethereum’s challenges in overcoming the $3,524 resistance, exacerbated by long-term holder liquidations reaching a two-year high. This bearish sentiment continues to shape Ethereum’s price trajectory, reinforcing the importance of monitoring key resistance levels for any potential recovery.


