NVDA, SMCI, and AMD price forecast: Stocks struggle below key resistance levels
 NVDA, SMCI, and AMD face selling pressure, with key resistance levels blocking recovery
NVDA, SMCI, and AMD all face strong resistance levels that need to be cleared for any bullish momentum to emerge. NVDA needs to break $124.39 for an uptrend to develop, while SMCI remains weak below $45.29.
AMD is the most vulnerable, struggling below $100, with $95 as critical support. Unless these stocks reclaim key moving averages, the broader trend remains bearish, with further downside risks in play.
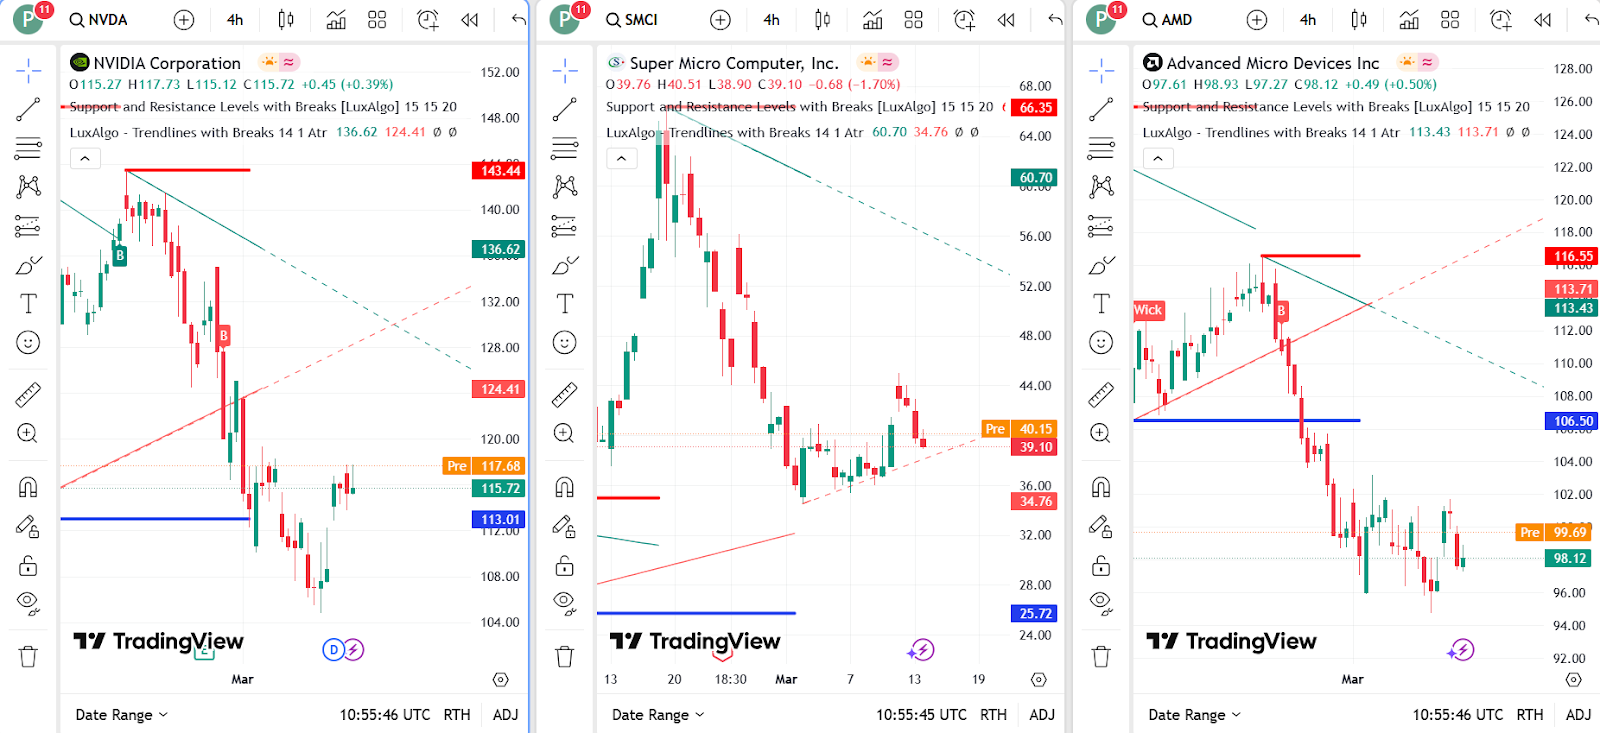
NVIDIA, SMCI, and AMD price dynamics (Source: TradingView)
NVIDIA (NVDA) faces resistance at $124.39
NVIDIA (NVDA) is attempting to recover after a sharp decline, with the stock trading around $117.62 in pre-market hours. Despite the mild rebound, NVDA remains below crucial resistance at $124.39, which has acted as a strong supply zone. A breakout above this level could open the path toward $136.60, but continued weakness may lead to a decline toward the $113.94 support zone.
The moving averages reinforce a bearish trend, with the 20-day EMA at $121.93, 50-day EMA at $126.86, and 200-day EMA at $128.56, all positioned above the current price. Meanwhile, the RSI at 46.88 suggests NVDA is recovering from oversold conditions, but still lacks bullish momentum. If the stock holds above $113.94, a bounce toward the middle Bollinger Band at $122.91 is possible. However, failure to sustain this level could push NVDA lower, with the lower Bollinger Band at $104.97 acting as key support.
Super Micro Computer (SMCI) hovers near support at $30.28
Super Micro Computer (SMCI) is experiencing extreme volatility, recently dropping 7.98% to $39.08. The stock is trading above a key support level at $30.28, which has historically acted as a strong demand zone. A break below $30 could accelerate losses toward $25.00, while any bullish reversal needs a breakout above $45.29, which aligns with the 200-day EMA.
SMCI remains in a bearish trend, as the 20-day EMA at $41.15 and 50-day EMA at $39.39 remain above the current price. The RSI at 47.78 suggests a potential rebound if it crosses above 50, but momentum remains weak. A move toward the middle Bollinger Band at $50.08 is possible if buying pressure increases. However, if SMCI fails to hold above $40, a retest of the $30 support zone is likely.
AMD struggles below $100, vulnerable to further downside
AMD continues to trade in a downtrend, with the stock currently at $98.11, reflecting a 2.66% decline. The 50-day EMA at $112.13 and 200-day EMA at $122.85 remain strong resistance levels, reinforcing the bearish outlook. The RSI at 40.91 indicates the stock is approaching oversold territory, with potential support near $96-$98. However, if AMD fails to hold $95, the next downside target is $90.
The MACD remains bearish, with the signal line below zero, showing no signs of a reversal. The Bollinger Bands suggest the stock is trading near its lower band at $99.71, which could lead to a minor bounce toward $105. However, without strong buying pressure, AMD remains vulnerable to further declines.
As noted in previous coverage, Nvidia's dominance in AI chip manufacturing remains a key driver of its stock price. The company has successfully navigated export restrictions and rising competition, while its collaboration with Cisco and major cloud providers signals continued demand. Although DeepSeek AI has raised concerns, Nvidia’s focus on scaling AI computing power and expanding its product line positions it well for long-term growth.


