S&P 500 price forecast: Index rebounds but faces resistance near 5,923
 S&P 500 rebounds from key support, faces resistance at 5,923
The S&P 500 (SPX) has experienced increased volatility, recently bouncing off-key support at 5,462 after a sharp decline from its March 2025 peak of 6,200. The index has recovered 0.31%, now trading at 5,638, but remains within a bearish structure.
While short-term bullish attempts are evident, technical indicators suggest that SPX must break above critical resistance levels to confirm a trend reversal.
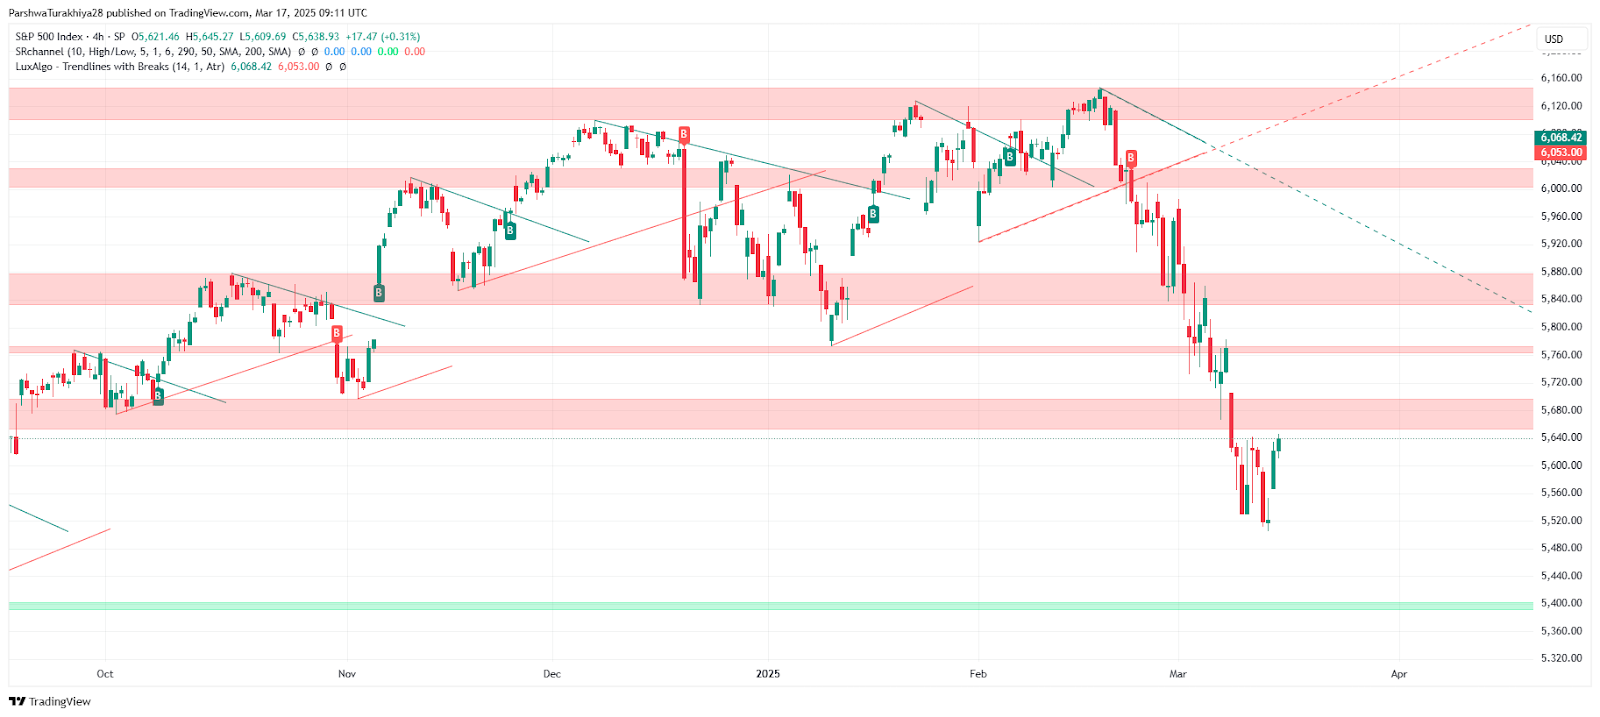
S&P 500 price dynamics (Oct 2024 - Mar 2025) Source: TradingView.
Key resistance and support levels
The SPX faces immediate resistance at 5,923, a previous support level that turned into a key barrier after the market downturn. If bulls manage to push the price above 5,923–6,000, the next target could be 6,100. However, if the index fails to sustain its upward momentum, a retest of 5,462 or lower levels such as 5,300 and 5,200 remains possible.
Bollinger Bands analysis suggests increased market volatility, with the upper band at 5,917 acting as a resistance zone and the lower band at 5,462 providing support. The middle band at 5,690 serves as a crucial pivot level. A break above this could indicate further upside toward 5,800, while failure to hold above this level may signal renewed selling pressure.
Technical indicators point to ongoing bearish sentiment
The Exponential Moving Averages (EMAs) reinforce the downtrend. The 20 EMA at 5,687 is acting as immediate resistance, while the 50 EMA at 5,824, 100 EMA at 5,894, and 200 EMA at 5,874 all remain above the current price, highlighting continued bearish control. A decisive move above the 50 EMA would be required to suggest a potential shift in sentiment.
The Relative Strength Index (RSI) is currently at 41.79, still in bearish territory. Although it has recovered from a low of 31.27, it must cross above 50 to indicate sustained bullish momentum. Meanwhile, the Moving Average Convergence Divergence (MACD) shows a weak recovery, with the MACD line at 3.44 and the signal line at -94.89. A bullish crossover is developing but remains unconfirmed.
Market outlook and conclusion
The S&P 500 remains in a fragile state, with the potential for a further decline if key resistance levels are not breached. If the price successfully breaks above 5,690, a move toward 5,800 and possibly 5,923 could follow. However, failure to sustain above this level could lead to another drop toward 5,513 or lower. Traders should closely watch whether the RSI crosses 50 and the MACD confirms a bullish crossover. The 5,690 level remains a key inflection point in determining whether the market can sustain a recovery or face continued downside risk.
In previous analysis, we highlighted that the 5,700–5,750 range serves as a significant resistance zone. The recent bounce aligns with prior market behavior, where SPX struggled to maintain momentum above key levels before facing selling pressure. A confirmed break above these zones would suggest a reversal, while rejection may lead to further declines.


