NVIDIA, Super Micro, and AMD price forecast: Key resistance levels in focus
 NVIDIA, Super Micro, and AMD stocks test key resistance levels
NVIDIA Corporation (NVDA) is trading at $121.63, showing a steady recovery as it moves toward key resistance levels. The 20-period EMA at $116.63 has been surpassed, confirming short-term bullish momentum.
However, the stock faces immediate resistance at $121.87 (50-period EMA) and further barriers at $126.63 and $128.41, corresponding to the 100-period and 200-period EMAs. A successful breakout above $122 could push the stock toward $126 and $130, with a potential extension to $135.95 if bullish momentum strengthens.
The RSI at 56.30 leans toward bullish conditions, but remains in neutral territory. A move above 60 would signal strong buying pressure. NVDA has bounced from the $112–$116 demand zone, making it a critical support region. If it fails to break above $124.95, renewed selling pressure could drive the stock toward $116, with additional downside risks to $112 and $108.
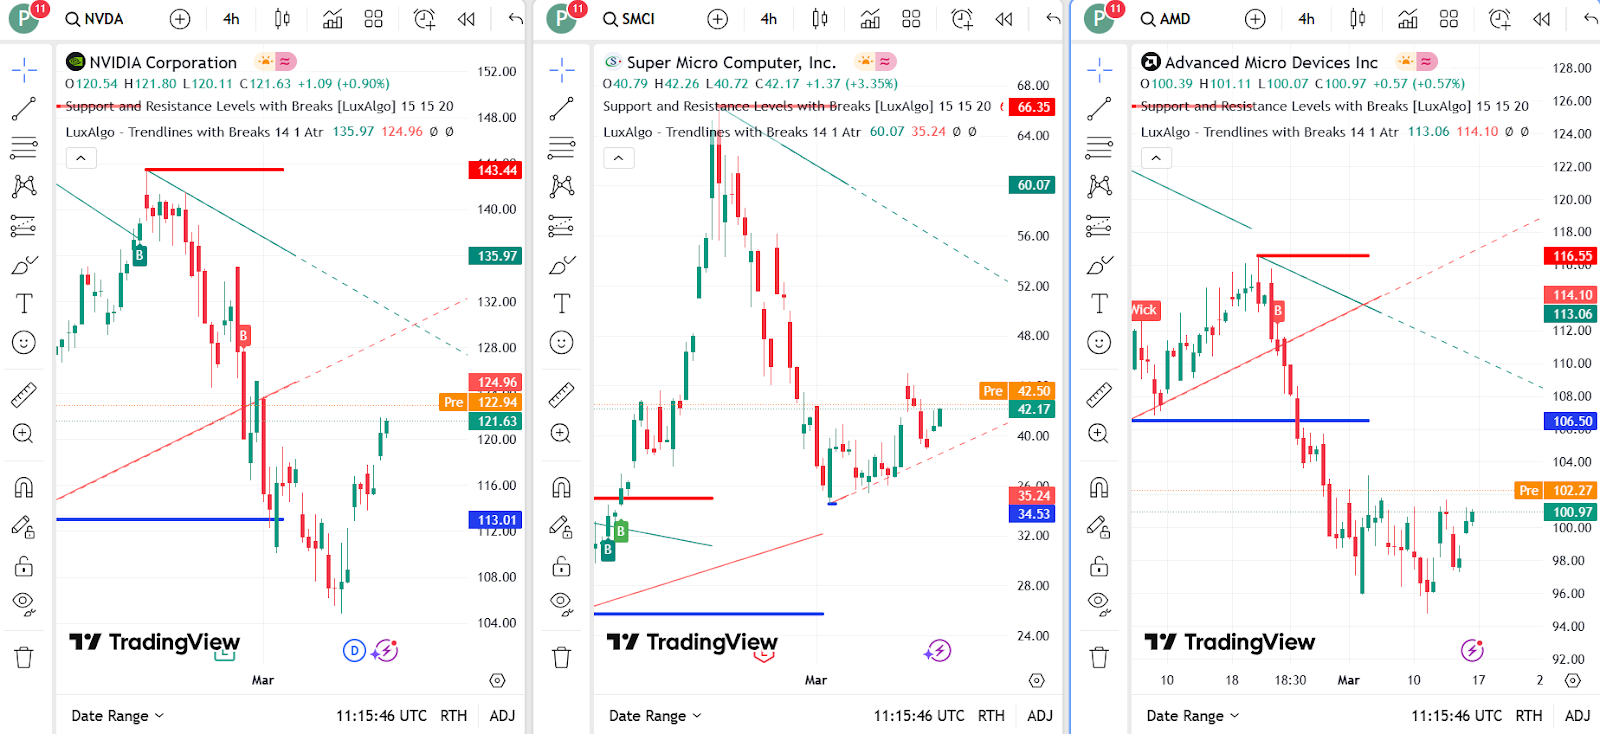
NVIDIA, SMCI, and AMD price dynamics (Source: TradingView)
Super Micro (SMCI) approaches key breakout zone
Super Micro Computer Inc. (SMCI) is up 3.35%, trading at $42.41, reflecting renewed investor confidence. The stock has moved toward the upper Bollinger Band, indicating increased volatility. It faces immediate resistance at $42.89 (50-period SMA), while the 100-period and 200-period EMAs at $39.57 and $40.55 suggest it has cleared a consolidation phase.
A break above $43 could lead to a rally toward $50, aligning with previous resistance. If the stock surpasses $45, it could extend gains to $60, where a prior breakdown occurred. The RSI at 56 supports continued recovery, but rejection at $45 could trigger a decline toward $35.24–$36.00. A sustained move above $45 would confirm a bullish reversal, while failure to hold $40 may result in further consolidation.
AMD struggles to break $104 resistance
Advanced Micro Devices Inc. (AMD) is trading at $100.44, gaining 0.57%, as it attempts to recover from a prolonged downtrend. The 20-period EMA at $100.18 is acting as immediate support, while the 50-period EMA at $104.70 serves as resistance. The 100-period and 200-period EMAs at $111.68 and $122.41 confirm a broader bearish trend, though a potential bullish MACD crossover suggests early signs of a trend shift.
For AMD to sustain an uptrend, it must break above $104 to target $113.06, with further upside to $120.00 if buying pressure strengthens. Key support lies at $96, with a breakdown exposing the stock to $90.00. A confirmed move above $113 would indicate a trend reversal, while failure to break $104 could lead to prolonged consolidation.
As previously discussed, NVIDIA’s bullish momentum is gaining strength as it consolidates above key support, but the $124.95–$126 range remains a critical resistance zone. Super Micro’s breakout potential above $45 could fuel further gains, while AMD needs a strong push past $104 to confirm its reversal.


