S&P 500 price forecast: Index rebounds, but key resistance remains in focus
 S&P 500 rebounds but struggles to break key resistance levels
The S&P 500 is showing signs of recovery, currently trading at 5,675.11, reflecting a 0.19% gain. This follows a bounce from 5,520, where buyers stepped in at a critical support level. However, major resistance lies ahead, particularly at the 200-period EMA at 5,870.71, which aligns with key technical barriers.
Short-term EMAs (20, 50, and 100-day) are converging between 5,683.92 and 5,885.23, highlighting that a break above 5,870-5,900 would be needed to confirm a bullish reversal. Without such a breakout, the index remains vulnerable to further downside pressure.
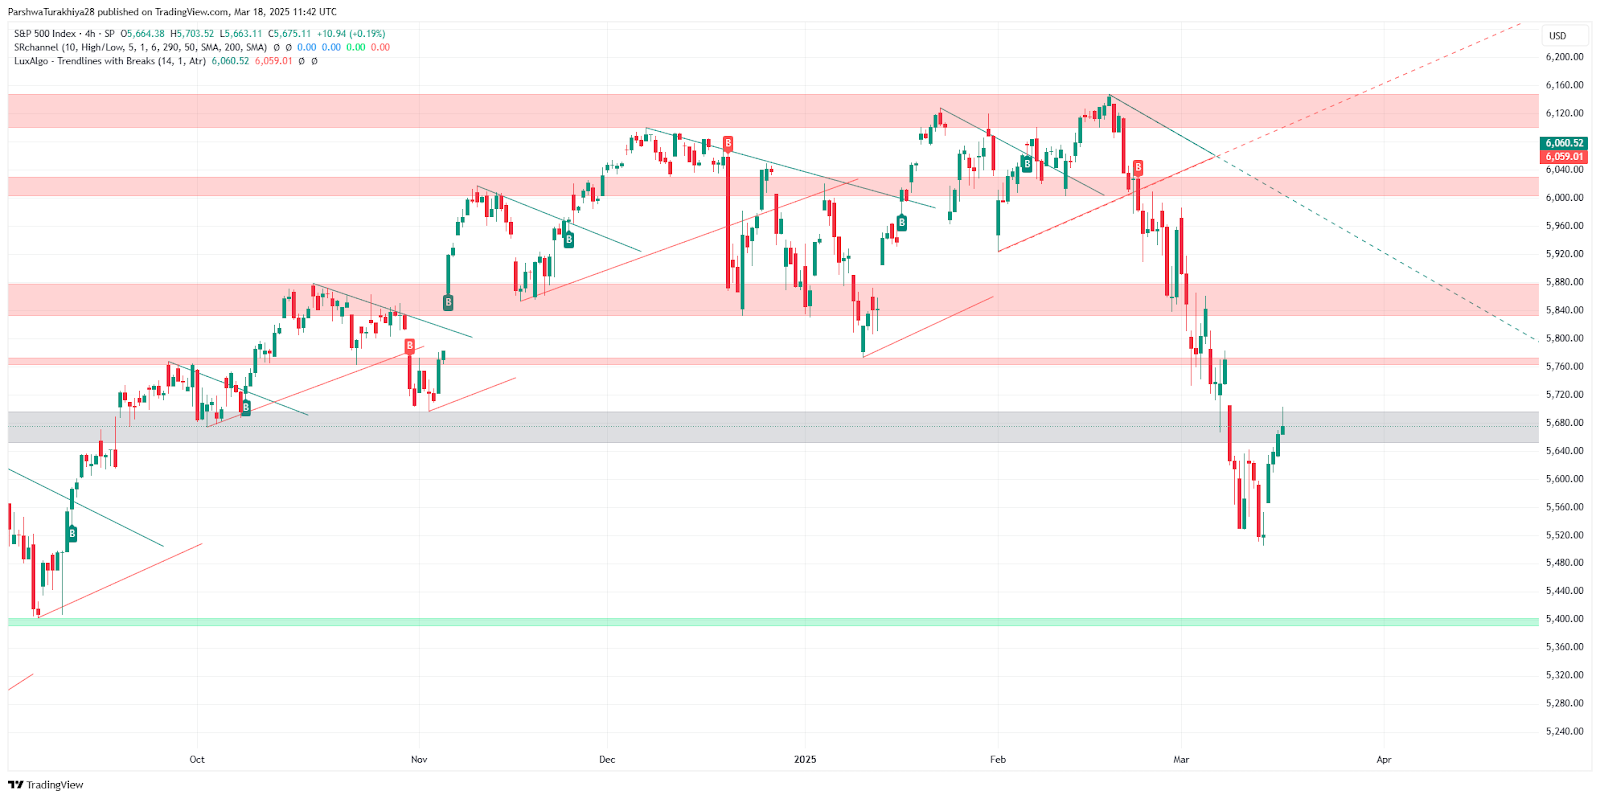
S&P 500 price dynamics (Oct 2024 - Mar 2025) Source: TradingView.
Momentum indicators point to cautious optimism
The Relative Strength Index (RSI) at 45.39 suggests that bearish momentum is easing but remains below the neutral 50 level. A break above 50 would reinforce buying momentum. Additionally, the MACD indicator shows early bullish divergence, with the histogram flipping positive at 16.00 and the signal line turning upward from -75.70. If the MACD line crosses above the signal line, further upside potential could emerge.
Bollinger Bands indicate that the index has rebounded from the lower band at 5,476.93 and is approaching the middle band at 5,669.85. The upper band at 5,862.78 coincides with the 200-day EMA resistance, suggesting that a break above this level could trigger a move toward 5,800 and beyond.
Support and resistance levels to watch
Traders are closely monitoring key support and resistance levels for the S&P 500 as the index navigates its next move. On the downside, crucial support levels stand at 5,557.38, followed by 5,538.28 and 5,400, which could provide a safety net in case of a pullback. Meanwhile, resistance remains firm at 5,870.71, with additional hurdles at 5,900 and 6,060.52 that may limit further gains. A breakout above these resistance levels could signal extended upside momentum, while a drop below support could invite further selling pressure.
A failure to sustain above 5,670 could see the index retracing to 5,538, a critical demand zone. Conversely, a break above 5,870 could push prices toward 6,100, confirming a shift in market sentiment.
As previously discussed, the S&P 500 remains in a cautious uptrend, with momentum indicators showing early bullish signs. However, a decisive move above 5,870-5,900 is required for confirmation. Traders should watch whether RSI crosses 50 and if MACD signals further upside potential.


