Microsoft, Amazon, and Alphabet stocks forecast: Bearish trends persist despite recovery attempts
 Tech stocks face resistance as bearish trends persist despite recovery attempts
Microsoft, Alphabet, and Amazon stocks remain under pressure despite short-term rebounds. Key resistance levels remain intact, with technical indicators suggesting that a sustained recovery requires stronger momentum.
Traders should watch Microsoft’s $409 level, Alphabet’s $174 resistance, and Amazon’s $206 breakout potential for signs of bullish reversals.
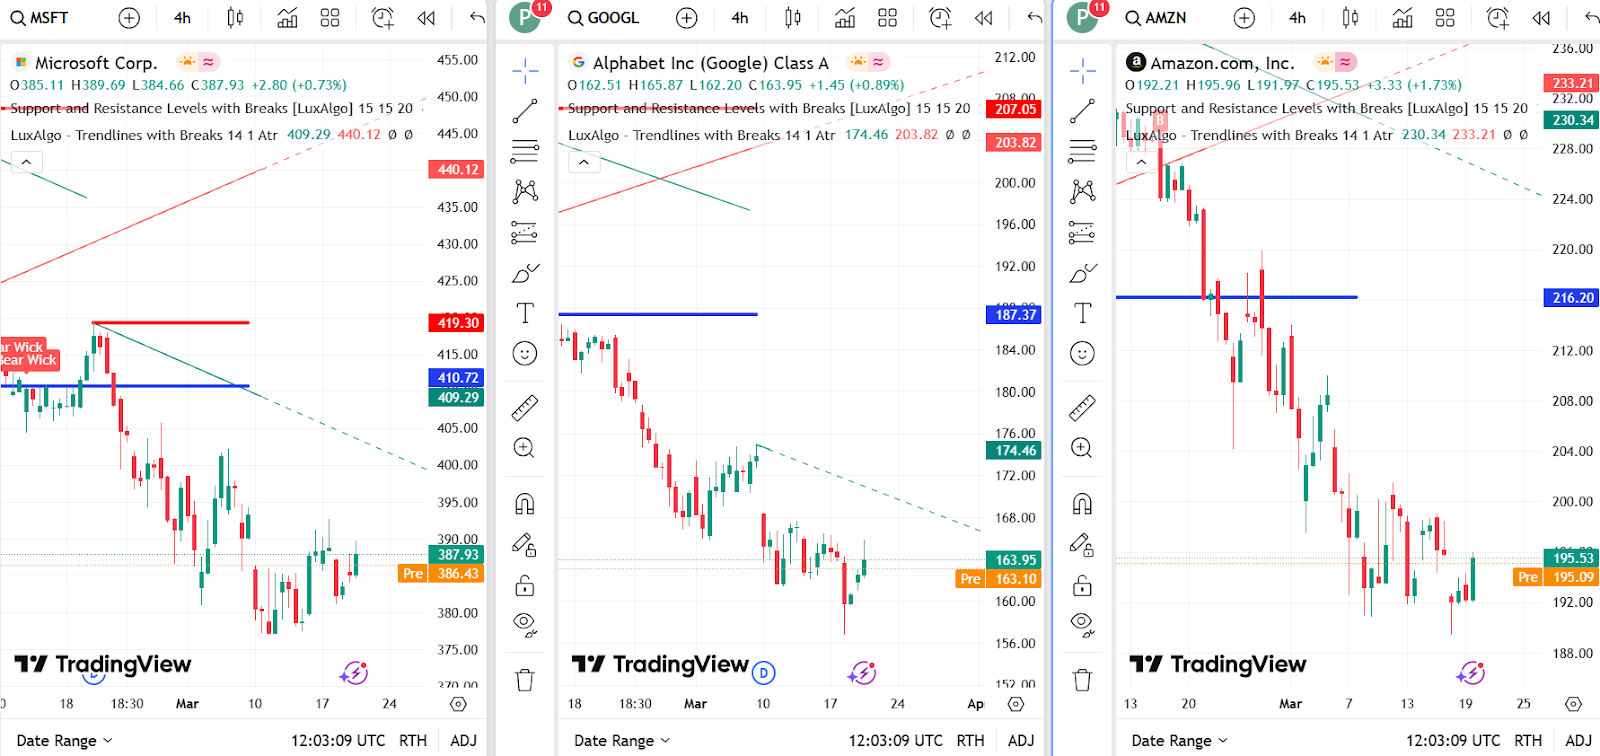
MSFT, GOOGL, and AMZN price dynamics (Source: TradingView.)
Microsoft struggles to break resistance amid downtrend
Microsoft Corporation (MSFT) is attempting a short-term recovery after a prolonged decline but remains below key resistance levels. The stock has faced multiple rejections near $436 and $448, with price action forming a downward channel. Currently trading at $387.82, MSFT has found temporary support near $374-$385, but the broader bearish trend remains intact.
Technical indicators reinforce this outlook. The 20 EMA at $386.99, 50 EMA at $395.03, and 100 EMA at $404.77 are all positioned above the current price, acting as resistance. Meanwhile, the Relative Strength Index (RSI) at 48.97 indicates neutral momentum, needing a move above 55 to confirm bullish strength. The MACD indicator suggests potential for a bullish crossover, but for now, downward momentum still dominates. A break above $409 would indicate a possible trend shift, while failure to hold $374 could lead to another leg lower.
Alphabet remains in a downtrend, facing key resistance
Alphabet Inc. (GOOGL) continues to struggle with lower highs and lower lows, confirming a bearish structure. The stock hovers around a key support zone between $160 and $157, and a breakdown below this level could send prices toward $152-$148. On the upside, resistance lies at $174, with a more significant supply zone at $184.
Moving averages further highlight selling pressure. GOOGL remains below the 20 EMA ($165.53), 50 EMA ($172.09), and 100 EMA ($177.55), reinforcing the bearish sentiment. The RSI at 43 suggests weak momentum, and the MACD continues to print negative bars, confirming persistent downward pressure. A break above $174 is required for momentum to shift in favor of buyers, while a breakdown below $157 could accelerate the decline.
Amazon holds critical support but faces strong resistance
Amazon (AMZN) stock has recently bounced off support near $190, currently trading at $195.53 with a 1.73% gain. However, the broader trend remains bearish, with the stock having declined from $245 to its current range. A falling wedge pattern suggests potential for a reversal, but strong resistance between $206 and $212 must be overcome for confirmation.
The 20 EMA at $197.55, 50 EMA at $206.38, and 100 EMA at $212.54 highlight Amazon’s struggle to regain bullish momentum. The RSI at 42.89 remains below neutral levels, and while the MACD suggests a potential bullish crossover, confirmation is needed. If Amazon breaks above $206, further upside toward $220 is possible. Conversely, a failure to hold $190 could lead to a retest of $175-$180.
In a previously discussed analysis, Alphabet’s stock demonstrated strong bullish momentum following the Wiz acquisition, positioning itself for further gains. However, the current price action reflects a bearish reversal, with key resistance levels at $174 and $184 capping upside potential. Until GOOGL breaks above these levels, the stock remains vulnerable to further declines toward the $157-$152 support zone, aligning with broader market pressures.


