S&P 500 index rebounds toward 5,700, but key resistance levels hold
 S&P 500 recovers from recent lows but struggles to break above key resistance zone
The S&P 500 index is showing signs of a technical rebound after enduring a multi-week decline from its March peak of 6,160. Currently trading around 5,667, the index has managed to recover from a short-term support range between 5,520 and 5,540.
This zone had previously acted as resistance during the December 2024 rally and is now serving as a base for bullish attempts. Despite this recovery, the index still faces a critical test at the 5,680–5,720 resistance bands, with a decisive break above needed to initiate a broader upside move.
U.S. stock futures opened higher on Monday, bolstered by last week’s gains, as investors looked for clues on economic momentum and trade policy clarity. The Dow added 1.2% last week, while the S&P 500 rose 0.51% and the Nasdaq climbed 0.17%, snapping a four-week losing streak. Traders now await Monday’s flash U.S. PMI data and earnings from KB Home and Enerpac Tool Group. Uncertainty remains ahead of President Trump’s April 2 reciprocal tariff rollout, though over the weekend, reports indicated the scope may be narrowed, potentially excluding some industry-specific duties.
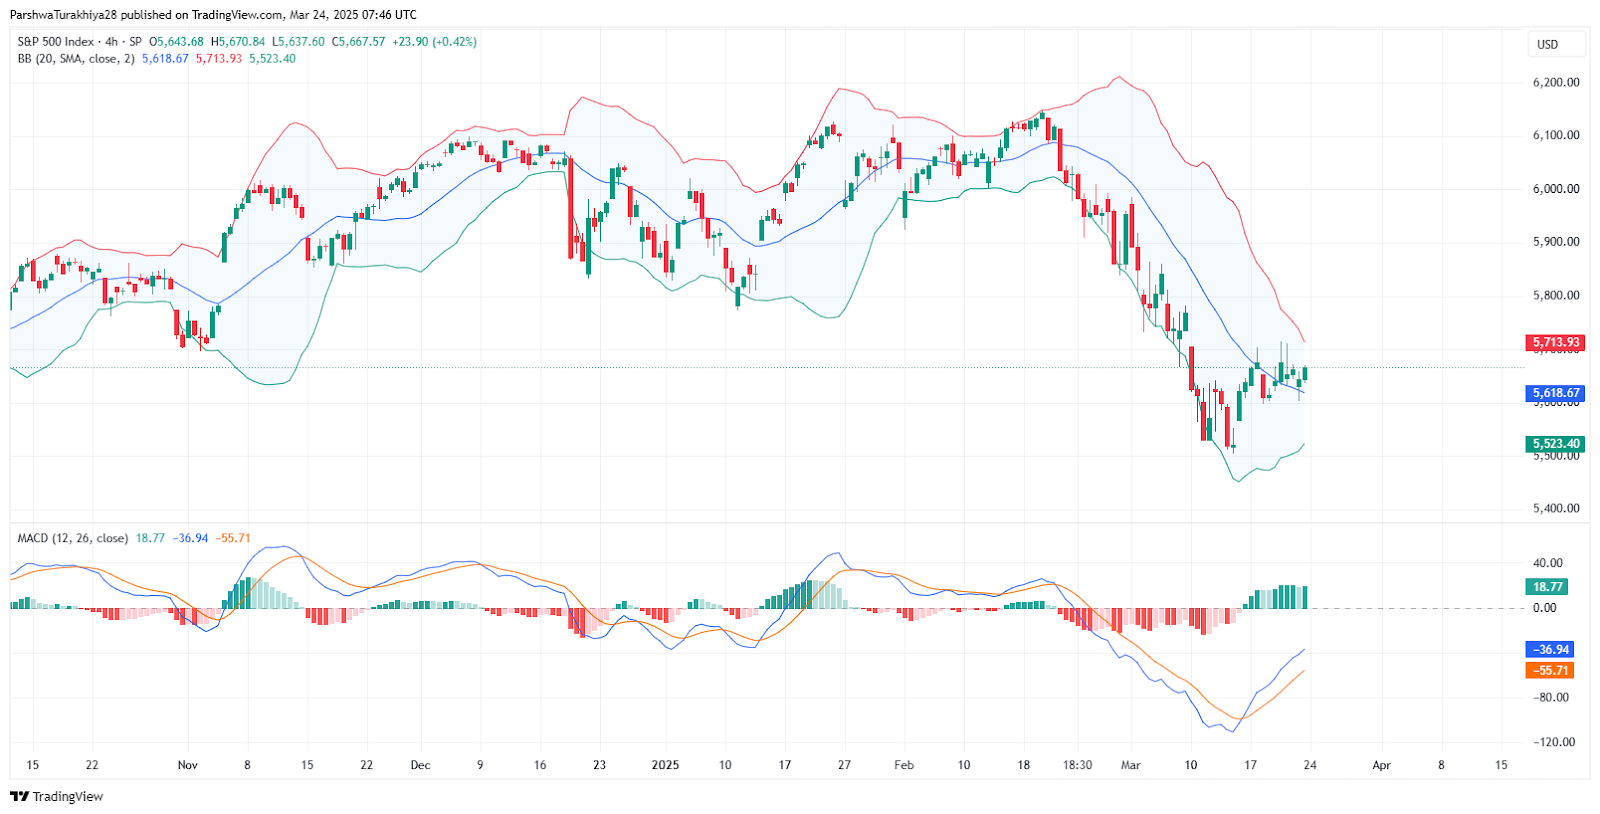
S&P 500 price dynamics (October 2024 - March 2025) Source: TradingView.
Technical signals show early bullish intent, but trend still fragile
On the 4-hour chart, the index trades below the 100 EMA (5,767.41) and 200 EMA (5,853.46), keeping medium-term sentiment cautious. However, shorter-term EMAs are beginning to converge around the current price level, suggesting a potential bullish crossover if momentum continues. The RSI has rebounded to 47.42 from previously oversold territory, and the MACD shows a recent bullish crossover, offering early signs of strength.
Meanwhile, Bollinger Bands are beginning to widen after a period of compression, and price is testing the mid-band near 5,618. A close above the upper band around 5,713 would confirm a near-term breakout. On the daily chart, however, the 50-day EMA at 5,767 still acts as a ceiling, and a break above the 5,850 level would be needed to establish a more sustained recovery.
Outlook remains cautious despite positive signals
While technical indicators hint at a developing bullish setup, the S&P 500 remains constrained by broader macro uncertainty, particularly around trade policy and upcoming economic data. Until the index convincingly clears the 5,720–5,850 zone, the risk of further consolidation or a reversal remains elevated.
As highlighted in earlier analysis, the index's ability to hold above the 5,520 level was a key condition for potential recovery. With that support now confirmed, a breakout above 5,720 backed by volume would strengthen the bullish case. However, traders should be prepared for range-bound movement unless macro catalysts offer stronger directional clarity.


