Tech stocks diverge as Nvidia stalls, Microsoft eyes breakout, and AMD approaches resistance
 MSFT leads tech gains as AMD and NVDA consolidate below key resistance levels
NVIDIA Corporation (NVDA) is trading at $117.64, up 0.49% on the session, as the stock attempts to recover from recent weakness. Bollinger Bands on the 4-hour chart are narrowing, indicating reduced volatility. The price is holding near the middle band at $115.64, with resistance overhead between $124 and $133. Technical indicators remain neutral to mildly bullish, with the MACD line crossing above the signal line and RSI hovering at 49.58. However, NVDA remains below all key exponential moving averages (EMAs), with the 100 and 200 EMA far above the current price at $125.02 and $127.39, respectively. A break above the $120 resistance could open the path toward a retest of the $125-$133 zone, while failure to hold $115 may trigger a deeper pullback toward $106.
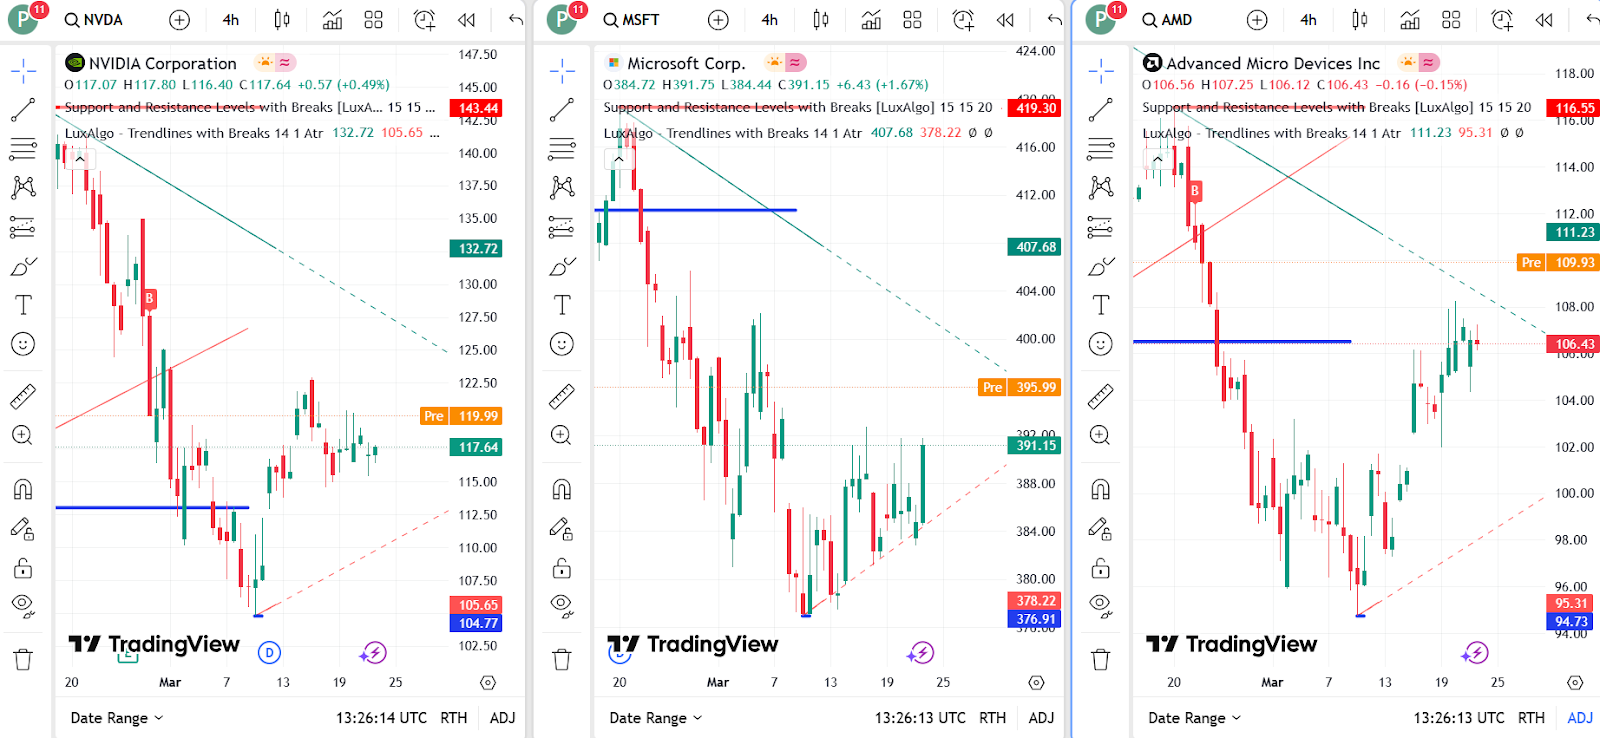
NVDA, MSFT, & AMD price dynamics (Source: TradingView.)
Microsoft gains strength as bulls test resistance
Microsoft Corporation (MSFT) is showing stronger momentum, gaining 1.67% to trade at $391.15. The 4-hour chart shows the price nearing short-term resistance at $391.89, as represented by the upper Bollinger Band. The MACD shows a bullish crossover and growing histogram, while the RSI at 53.52 suggests continued but moderate buying interest.
MSFT has already reclaimed its 20 EMA and is approaching the 50 EMA at $393.87. An ascending triangle pattern has emerged, with a potential breakout above $396 targeting $407 and even $420 in the medium term. Support is seen near $384 and $378, levels that could be retested if bulls fail to sustain momentum.
AMD faces overhead resistance as rally cools
Advanced Micro Devices (AMD) is under mild selling pressure, down 0.15% to $106.43. Although the MACD remains in bullish territory and the stock trades near the upper Bollinger Band at $109.55, the RSI has flattened at 49.50, indicating waning momentum. Price is struggling to stay above the 20 and 50 EMA levels, with critical resistance between $109–$111. The broader structure forms a rising wedge pattern within a longer downtrend. A breakout above $111 could fuel a rally toward $120, while failure to hold $103 could lead to a pullback toward the $100–$95 zone.
In prior analysis, NVDA was noted to be entering a contraction phase below the 100 and 200 EMAs, which continues to limit its breakout potential. MSFT had shown bullish divergence on the MACD and RSI, and this momentum appears to be building. AMD remains technically conflicted, and as discussed earlier, the $109–$111 resistance zone remains the inflection point for its next major move.


