S&P 500 price clings to support ahead of tariff rollout as bulls eye key breakout levels
 S&P 500 awaits direction as markets brace for new tariffs and navigate technical resistance
U.S. stock futures remained steady early Wednesday as investors awaited clarity on President Donald Trump’s reciprocal tariffs, expected to be unveiled later in the day. The market's cautious tone comes despite a modest rebound on Tuesday, with the Nasdaq Composite rising 0.87% and the S&P 500 gaining 0.38%.
The Dow Jones, however, edged lower by 0.03%, weighed down by broader trade tensions and mixed economic data.
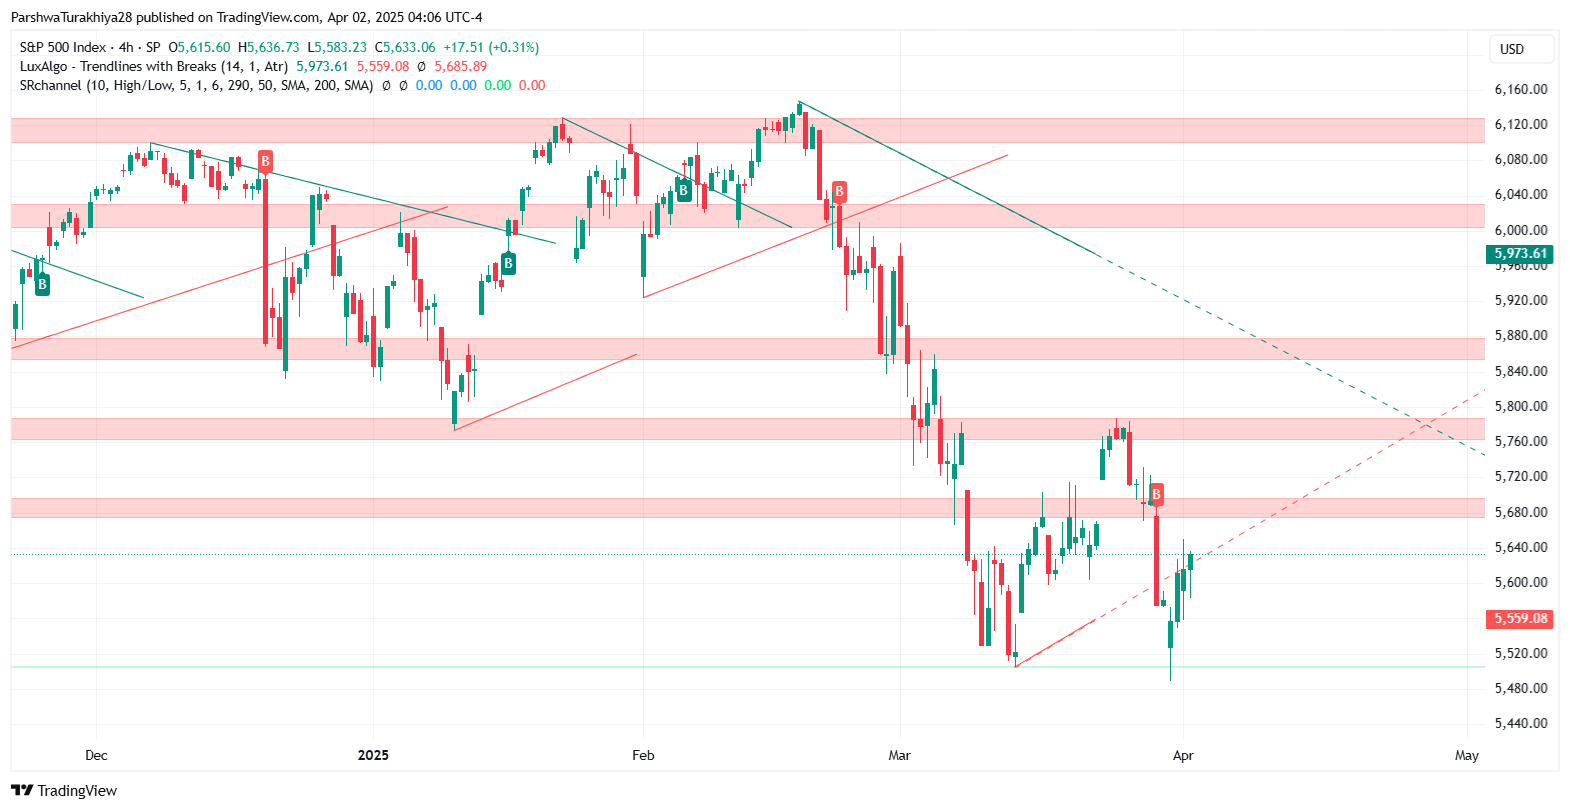
S&P 500 price dynamics (December 2024 - March 2025) Source: TradingView.
Tariff risks and economic softness shadow index recovery
Trump’s planned tariffs have created uncertainty, particularly as the scope and enforcement mechanisms remain undisclosed. Treasury Secretary Scott Bessent attempted to ease concerns, stating the levies would serve as a “cap” and could be reduced by partner countries with favorable trade policies. Still, fears of global retaliation linger.
On the economic front, March data confirmed continued weakness in the factory sector, with manufacturing activity contracting again and input prices rising at their fastest pace since 2022. Job openings also fell short of expectations, coming in at 7.57 million, reinforcing the view of a cooling labor market and further complicating the Federal Reserve’s policy outlook.
Technical outlook: Wedge pattern suggests potential but resistance looms
The S&P 500 recently rebounded from key support between 5500 and 5520, reclaiming the 0.618 Fibonacci retracement at 5612.46. However, the index remains trapped within a descending wedge pattern. Technical resistance zones between 5675 and 5730 remain intact, capping gains despite a mild recovery. The RSI is neutral but trending slightly higher, and MACD histograms are narrowing, hinting at waning bearish momentum.
To confirm a shift toward a bullish structure, the index must break above the 50-period EMA at 5723.25 and surpass the wedge’s falling trendline. A successful move could set the stage for a retest of 5846.95, the recent swing high. Conversely, a drop below 5612.46 would expose the index to further downside toward 5556.06 and potentially 5504.65.
In earlier coverage, we highlighted that the S&P 500’s ability to hold the 5500–5520 support zone was critical for sustaining bullish sentiment. The current wedge formation and narrowing MACD histograms align with our prior view that while technical recovery is underway, confirmation through breakout and volume remains essential before reassessing the trend bias.


