Apple stock price rebounds sharply but faces key resistance between $211–$224
 Apple rebounds near $198, but resistance looms at $211–$224
Apple Inc. (NASDAQ: AAPL) staged a strong rebound this week, rallying over 4% on the day to trade near $198.15 as investors responded positively to a technical recovery from April’s low of $185. Shares have bounced off the $208.42 support zone—an area reinforced by a historical breakout cluster and the 0.236 Fibonacci retracement level—suggesting buyers are stepping in at key long-term support.
Despite the sharp upside move, Apple remains below major resistance zones, including the 0.382 and 0.5 Fibonacci retracement levels at $224.38 and $229.21 respectively. The stock also faces structural pressure from a descending trendline drawn from the all-time high of $250, currently intersecting the $211–$216 band. This zone now acts as both Fibonacci resistance and a confluence of dynamic levels, including the 50 and 100 exponential moving averages (EMAs).Momentum indicators are beginning to reflect bullish interest, but signals remain mixed. The 4-hour Relative Strength Index (RSI) has risen to 47.50, off oversold levels near 30. MACD readings show a recent bullish crossover with a positive histogram, indicating early recovery momentum. Meanwhile, the Stochastic RSI has spiked above 70, suggesting buyers are gaining strength but could face a near-term cooldown.
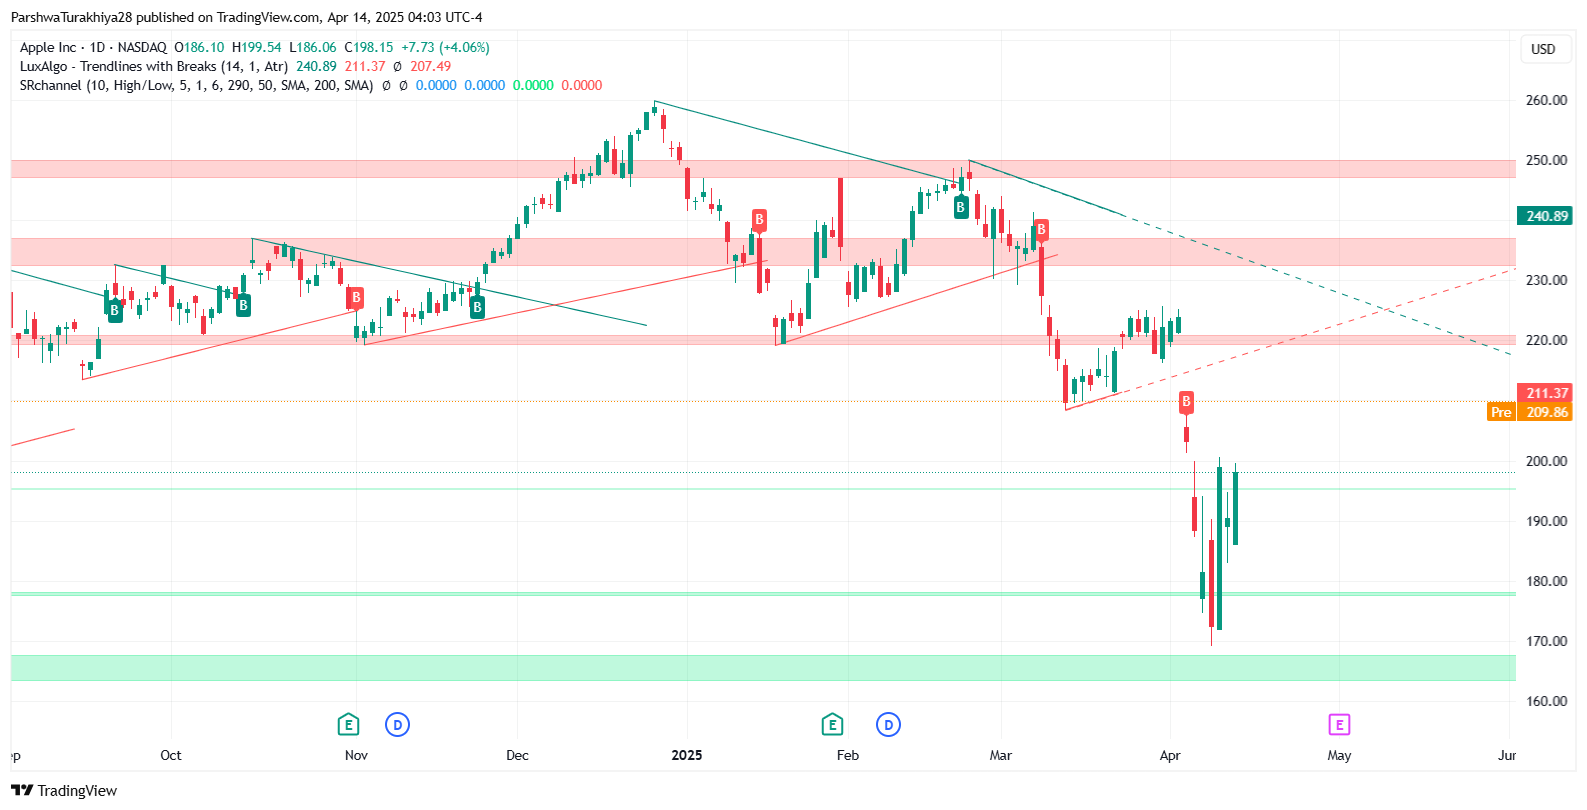
AAPL price dynamics (September 2024 - April 2025) Source: TradingView.
Outlook depends on breakout above $218–$224
For a confirmed bullish reversal, Apple must reclaim the $218–$224 zone, where multiple technical resistances converge. A clean breakout above $233.12—the 0.618 Fibonacci retracement—would likely invite further upside toward the prior high at $250 and the extended target at $275 (1.618 Fib extension). Failure to clear resistance, however, could prompt a pullback toward $185–$190, retesting recent lows.
In our earlier Apple coverage, we highlighted the importance of the $208–$216 region as a pivot zone for trend confirmation. This remains valid, and traders should continue monitoring volume and price action near the EMAs to assess breakout strength.


