Intel stock price eyes recovery, but key resistance at $21.6 caps upside
 INTC rebounds near $20.6 but faces stiff resistance at 50 and 100 EMAs
Intel Corporation (NASDAQ: INTC) shows early signs of recovery after months of persistent downside pressure, with the stock bouncing from a multi-month low near $18.18. A double-bottom-like formation around the $18–$19 accumulation zone has triggered short-term bullish momentum, taking the stock up to $20.6 as of Friday. However, significant resistance looms ahead, and the broader downtrend remains intact.
Intel’s bounce has brought it into a crucial confluence zone between $20.6 and $21.6. This range includes the 0.786 Fibonacci retracement level from the $26.41–$19.29 swing, as well as the 50 EMA ($21.63) and 100 EMA ($21.92). The 200 EMA sits slightly above at $22.28, making this region a major barrier for trend reversal. On the downside, the $18.2–$19.2 support band has held through several tests and remains key to maintaining the current bullish structure. A break below would expose INTC to a deeper correction toward $14.89, which aligns with the 1.618 Fibonacci extension.
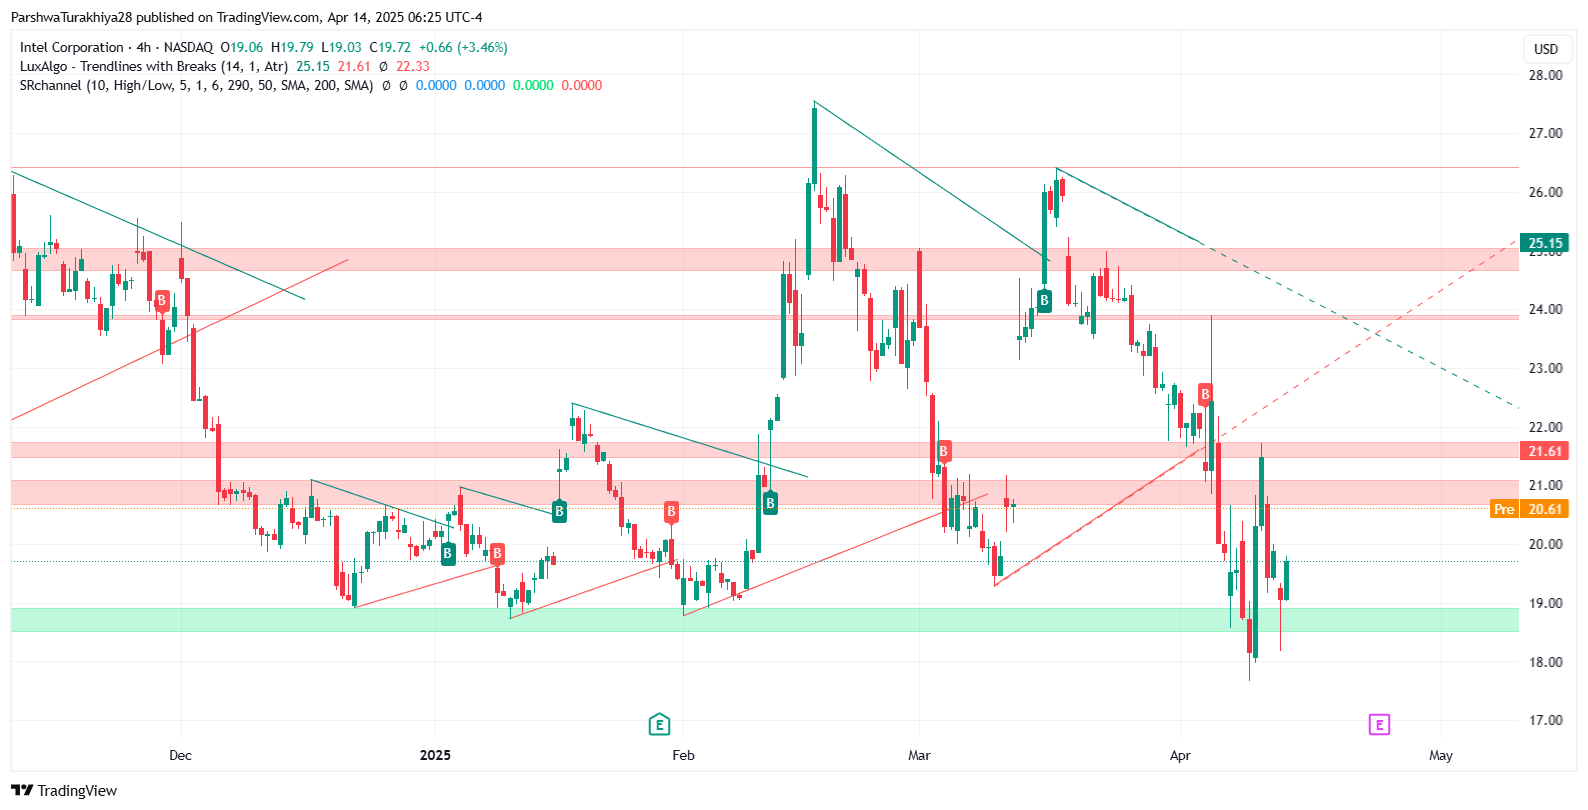
INTC price movement (December 2024 - April 2025) Source: TradingView.
Indicators point to cautious optimism
Momentum indicators show gradual improvement. The 4-hour RSI stands at 43.65, rising from earlier oversold readings, while the Stochastic RSI is approaching overbought territory, suggesting limited upside before a pause.
The MACD remains below the zero line but is tightening, and a bullish crossover could emerge in the coming sessions. Meanwhile, Bollinger Bands have contracted after a prior volatility spike, and price is attempting to hold above the midline at $20.64. Volume has increased modestly during the recovery, suggesting accumulation interest at lower levels.
Outlook hinges on breakout confirmation above $21.6
Intel’s technical setup offers a potential short-term reversal, but the path forward is tightly contested. Bulls must reclaim the $21.6–$22.3 zone with volume to shift the broader trend. Without this breakout, the bounce may fade and turn into another lower high in the existing downtrend. Traders should monitor the next two daily closes for validation of a breakout or a continuation of the bearish structure.
Our earlier analysis emphasized that Intel’s $18–$19 base could be a critical zone for reversal. That outlook remains valid, but confirmation depends on breaching resistance layers stacked above the current price.


