Apple price rebounds nearly 29% from April bottom, but faces strong resistance at $212
 Apple shares face rejection at key resistance, weakening bullish momentum
Apple Inc. (NASDAQ: AAPL) is showing signs of hesitation near a key technical resistance after a strong bounce from its April low around $165. The stock surged over 25% in just over a week, reaching as high as $212 before encountering rejection near the descending trendline and horizontal supply zone that spans $212–$218.
Despite piercing the trendline, price failed to close above it, highlighting continued overhead pressure from earlier breakdown levels.
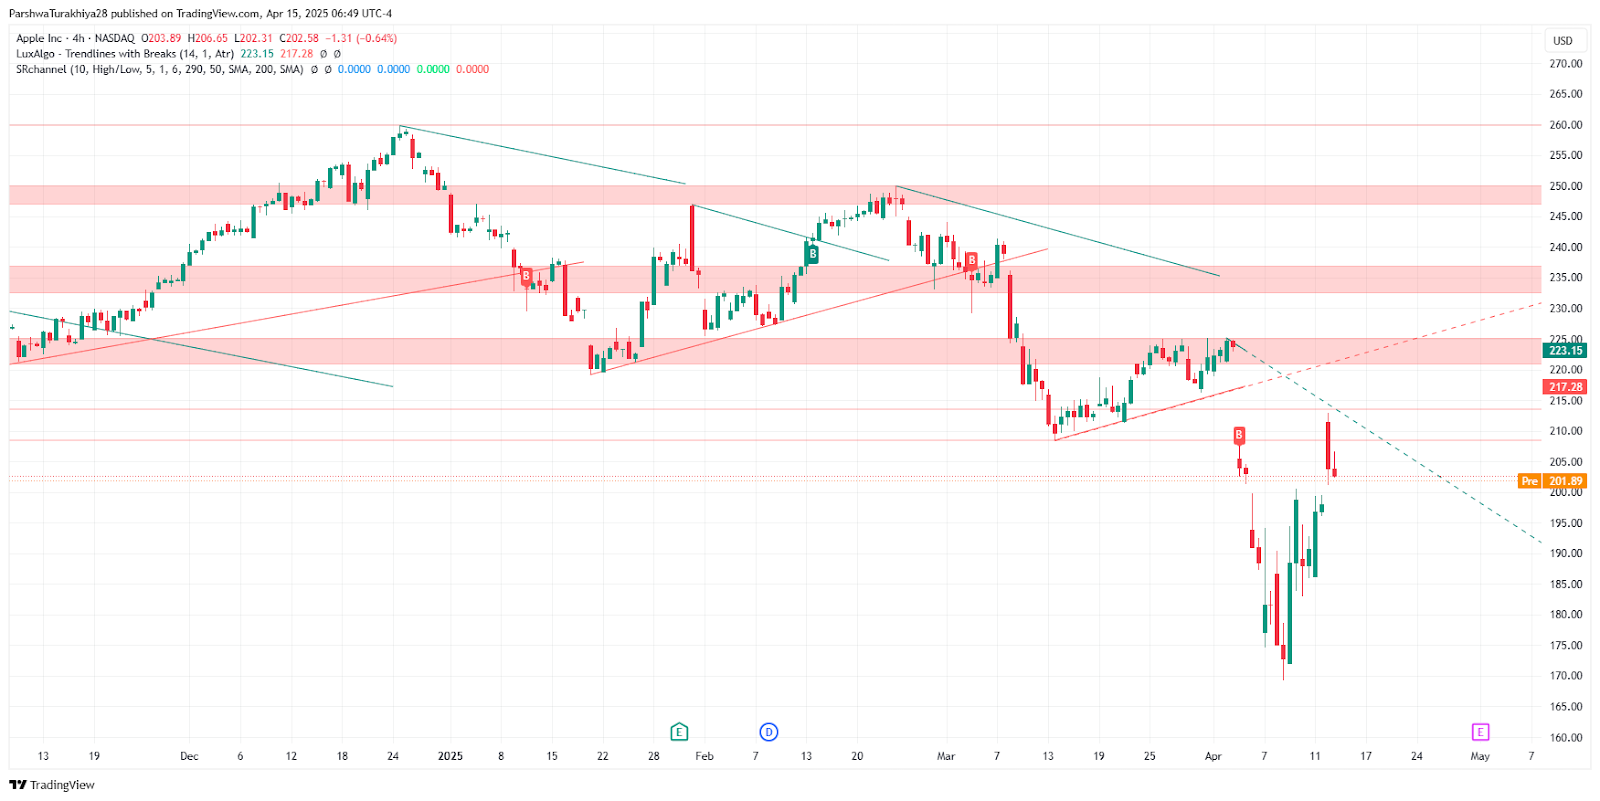
Apple stock price dynamics (December 2024 - April 2025) Source: TradingView.
Technical rejection confirms overhead resistance
The rejection aligns with the 23.6% Fibonacci retracement level at $218.23, measured from the $250 high to the $208.42 low, and coincides with historical resistance from February. While the stock briefly surged on strong volume—daily trading peaked at 1.7 billion during the recovery—momentum has since faded. Price now hovers below the EMA 50 on the 4-hour chart ($208.88) and remains significantly under the daily EMA 200 ($224.11), both of which have acted as dynamic ceilings in past rallies.
MACD still shows a bullish crossover, with a positive reading of 2.36, though its histogram is narrowing—a sign of fading momentum. Meanwhile, RSI has dropped from higher readings and currently stands at 50.90, reflecting indecision in the current trend. A further drop below 45 could reinforce a shift back into bearish momentum.
Outlook cautious as Apple struggles to reclaim mid-term highs
Bollinger Bands analysis reveals a sharp rejection from the upper band near $229, with price now gravitating toward the mid-band around $198. A breach of this midpoint could expose Apple to renewed selling pressure toward $190 or even the $185–$167 support band, aligning with historical demand and the lower Bollinger Band. Traders will closely watch the $198–$200 zone as the near-term pivot for either stabilization or breakdown.
Apple had been testing recovery levels post a steep drawdown earlier in April. As flagged in earlier analysis, the $218–$224 region is a key inflection zone where any sustained breakout could lead to a move toward $240–$250. So far, the rejection near $212 supports the cautious stance we outlined last week, reinforcing the need for bullish volume confirmation before upside continuation.


