Intel stock price trades near critical resistance as traders eye breakout or renewed decline
 Intel shares approach major resistance as investors monitor for technical breakout
Intel Corporation (NASDAQ: INTC) is trading in a tight consolidation phase, with price action reflecting indecision at a key technical inflection point. Shares of the chipmaker have rebounded modestly from a recent swing low near $19.29 but remain capped below multiple resistance levels, including the crucial 0.786 Fibonacci retracement at $20.1 and a descending trendline from the February 2025 high of $26.41.
Intel’s recent movement has seen it coil within a symmetrical triangle on the 15-minute chart, signaling growing pressure as price oscillates near $20.36. The intraday setup suggests that a breakout above $20.93 could pave the way for a rally toward the broader resistance band at $21.75–$22. On the downside, failure to hold above the $20.1 threshold could open the door to a retest of $19 or even $18, a zone aligned with a long-standing demand cluster and prior support.
Higher time frames show a bearish market structure persisting. Intel’s price remains trapped below the 100 and 200 EMA levels at $21.86 and $22.24, respectively, while also sitting inside a thick Ichimoku Cloud on the 4-hour chart—suggesting equilibrium with a downside bias. The broader descending trend channel remains intact unless the price breaks and sustains above $22.24.
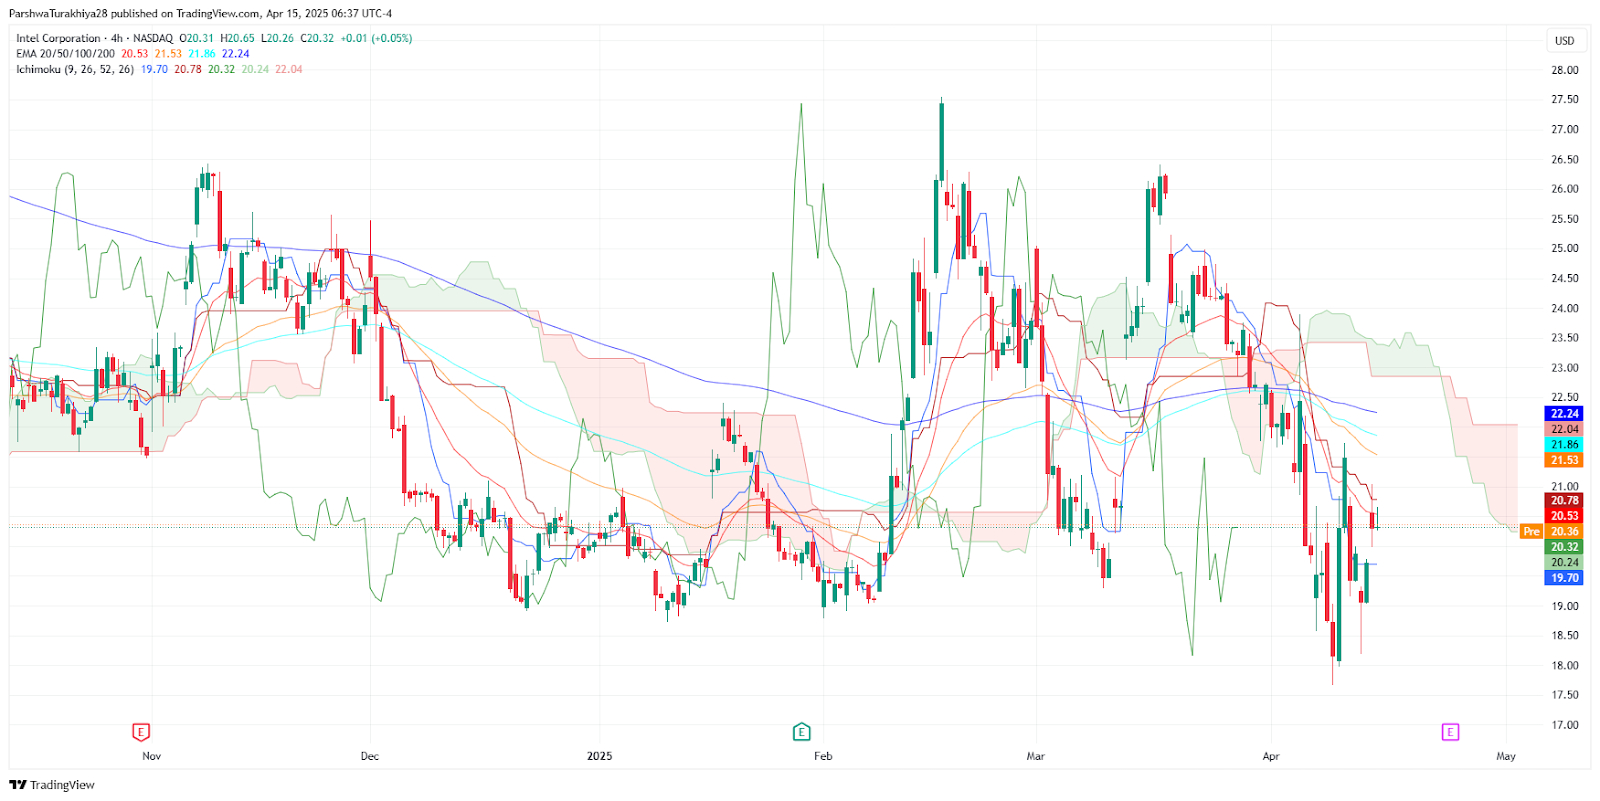
Intel price dynamics (November 2024 - April 2025) Source: TradingView.
Momentum indicators show mixed signals
Technical indicators are showing early signs of recovery, but conviction remains weak. The MACD histogram has turned slightly positive, though the MACD line remains marginally above the signal line.
RSI stands at 47 on the 4-hour chart—neutral territory—while the Stochastic RSI is flirting with overbought conditions. Volume, notably elevated near the recent lows, suggests accumulation may be occurring, but the lack of a high-volume breakout continues to limit bullish follow-through.
Outlook hinges on breakout resolution
Intel’s stock appears poised for a decisive move as traders await a breakout or breakdown from the current range. A confirmed break above $22.24 would likely reverse the bearish trend and target $24–$25, while failure to defend the $19 zone could signal deeper downside toward $14.89 or lower. Given the compression between critical EMAs, Fibonacci retracement levels, and trendlines, traders are advised to monitor volume spikes and RSI divergences to identify directional confirmation.
In earlier technical reviews, Intel was noted to be trading around $19.2–$20 as a critical zone. The current analysis further reinforces that this region is a pivot for the next major leg, either toward bullish reversal or deeper correction.


