Apple stock price rebounds to $202 but faces heavy resistance amid low volume recovery
 Apple stock recovers to $202 but struggles below $210 resistance zone on weak volume
Apple Inc. (AAPL) climbed to $202.12 in midweek trading, rebounding from recent lows near $170 as investors positioned ahead of upcoming earnings and macroeconomic data. However, the stock is confronting a major resistance zone between $208 and $223, a region reinforced by multiple exponential moving averages (EMAs) and prior failed rallies.
Despite short-term bullish technical signals, momentum remains fragile as volume fails to confirm the strength of the move.
On the 4-hour chart, Apple trades slightly above its 20 EMA at $199.4 but remains below the 50, 100, and 200 EMAs — located at $208.34, $217.54, and $223.67 respectively. These levels collectively act as a ceiling and must be cleared for a structural trend shift. The RSI stands neutral at 50.54, indicating consolidation, while the MACD has turned positive with a modest bullish crossover. However, the Volume Oscillator at -26.44% underscores a lack of strong buying conviction.
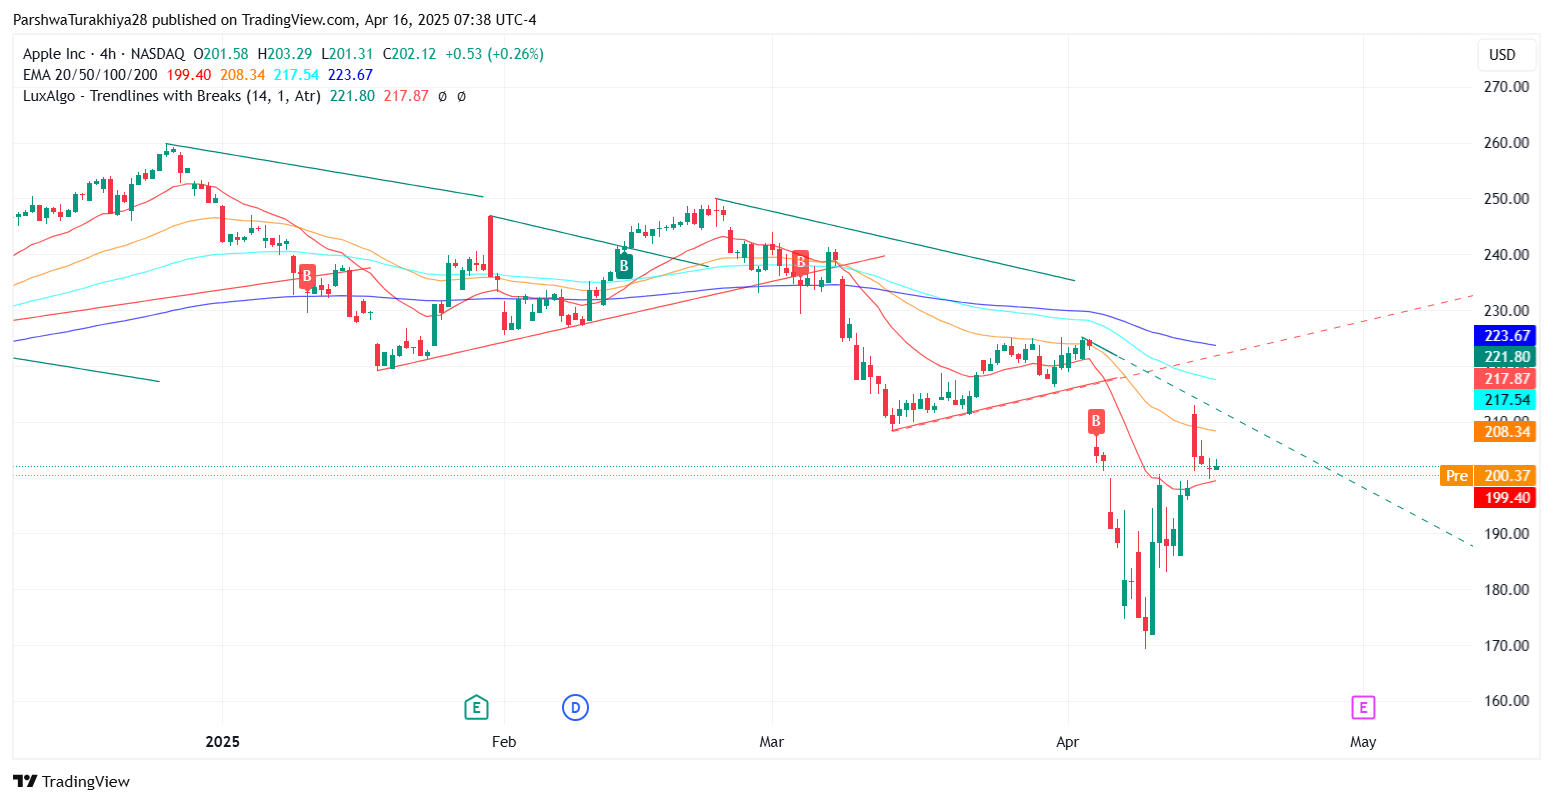
AAPL stock dynamics (January 2025 - April 2025) Source: TradingView.
Sideways consolidation hints at breakout setup
Intraday price action on the 30-minute chart reveals Apple consolidating beneath descending resistance from $210.62, forming a potential symmetrical triangle pattern. This structure, combined with narrowing Bollinger Bands on the 4-hour timeframe, suggests price compression and sets the stage for a volatility breakout. The current band range of $195.85 to $222.41 implies $210 remains a key inflection level in the short term.
A decisive close above $212–$217 could initiate a momentum-driven leg toward $225 and even $240. Conversely, a failure to hold above $199 would likely expose $190.50 and lower supports near $180–$165.
As noted in earlier analysis, Apple’s price rebound was expected from the $165–$175 zone. While the MACD and RSI now favor consolidation, the broader downtrend remains unbroken unless the price sustains above $217 with increased volume.


