Microsoft shares down 4.2% in April after 5 days of losses
 Microsoft slides 10%, tests key support level
Microsoft (NASDAQ: MSFT) shares have extended their losing streak to five consecutive days, reflecting broader risk-off sentiment across U.S. equities. The decline began after the stock hit a recent high of $395.0 last week. Since then, the price has tumbled nearly 10%, closing Monday at $359.1 just above the day’s low of $355.5.
The decline followed a volatile open on Monday, where Microsoft started at $362.80 and briefly climbed to an intraday high of $364.50 before slipping 2.38% to the day’s low. Although the stock managed to close slightly off the bottom at $359.10, it still recorded a 1% loss for the session.
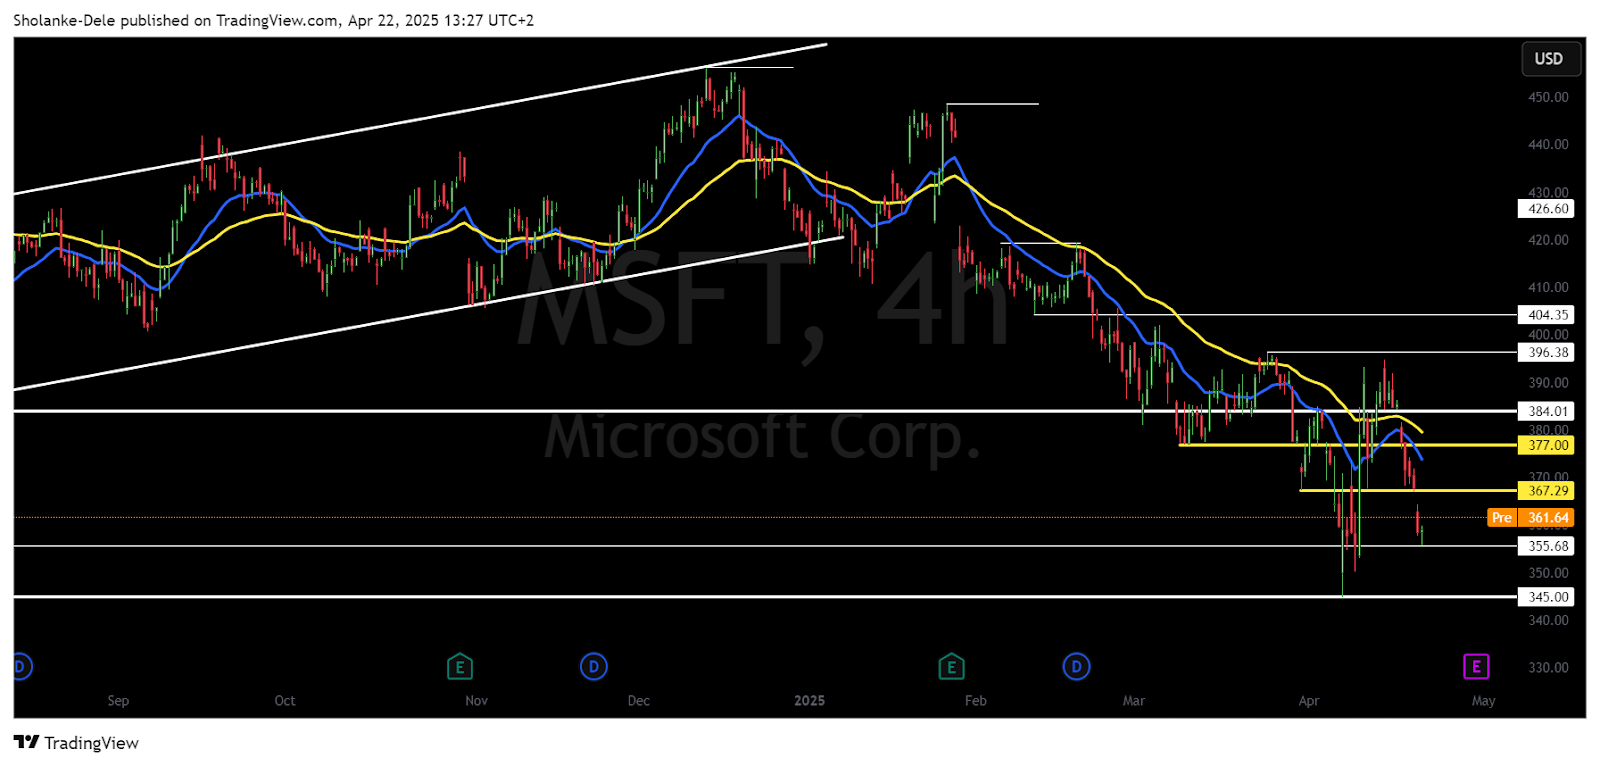
MSFT price dynamics (Sept 2024 - April 2025). Source: TradingView
Broader market weakness contributed to the bearish pressure. Investors appeared to rotate out of U.S. assets in response to policy uncertainties linked to Donald Trump’s political trajectory. This shift in sentiment weighed not only on Microsoft but also on major indices across Wall Street.
Microsoft stock stays below daily EMA and below RSI 40 levels
Technical indicators suggest there’s more room for downside. Microsoft is currently trading well below its 20-day and 50-day exponential moving averages. The 20-day EMA now acts as a resistance level near $377.00 which was once a support zone, but before that, there’s an additional resistance level at $367.30, limiting near-term recovery prospects.
The RSI momentum indicator confirms that further downside is expected. Both the daily and 4-hour Relative Strength Index (RSI) readings are lodged below 40, a region historically associated with extended selling pressure. If this RSI weakness persists, Microsoft is likely to break the $355.50 support established on Monday.
Today, Tuesday, April 22, Microsoft is set to pre-open at $361.70. Month-to-date, the stock is down 4.2%, deepening its year-to-date decline to 15.6%. That places the current price action just above April’s low of $345.00, which is Microsoft’s weakest level since October 2023.
The setup points to the potential for further retracement of $355.50 gives way. Below that, $345.00 stands as the next key level to watch. All signs suggest that bearish pressure could continue unless broader market sentiment or technical momentum shifts decisively.
Microsoft lost 6.7% this week, reversing gains from the impact of 90-day tariff pause news. The four-day slide pointed to a clear shift in market sentiment and technical weakness.


