S&P 500 index price tests breakout zone above 5,500 as bulls attempt to overcome trendline and EMA resistance
 S&P 500 tests key resistance as bulls eye breakout, momentum indicators align
The S&P 500 extended its rebound toward the 5,500–5,520 zone on Friday, testing a crucial resistance area formed by a descending trendline and prior support-turned-supply on both the daily and 4-hour charts. Following a sharp selloff in mid-April that dragged the index near the 4,900 mark, the recovery has been marked by a consistent pattern of higher lows, forming a rising triangle within a broader descending structure.
This technical pattern reflects a buildup of bullish pressure beneath resistance. The 5,530 level has acted as a cap in recent sessions, and a decisive break above it could trigger a renewed rally toward 5,620 and 5,720. However, failure to clear this level may lead to consolidation or a pullback toward 5,300 support.
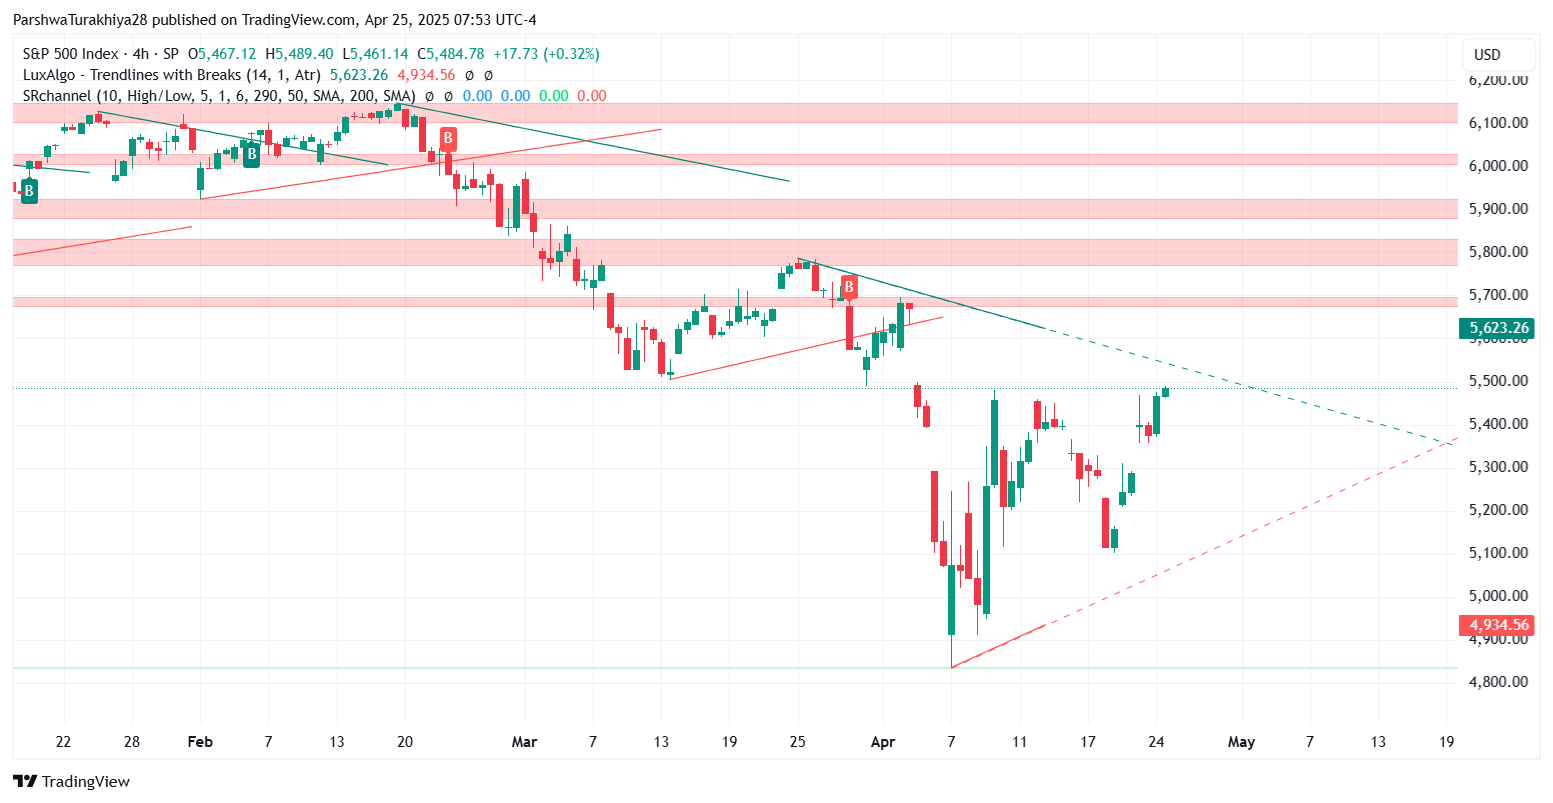
S&P 500 price dynamics (January 2025 - April 2025) Source: TradingView.
Momentum signals favor bulls but trendline test looms
On the 4-hour chart, the index is trading just above the 20 EMA (5,341) and 50 EMA (5,425), while remaining beneath the 100 EMA (5,569). A daily close above this longer-term moving average would support a shift in short-term trend bias. The MACD has crossed into bullish territory, with the histogram building green bars and momentum expanding. RSI stands at 58, suggesting continued upside potential without yet entering overbought territory.
Still, the index is pressing against the upper Bollinger Band around 5,512, which could lead to a brief cool-off or range-bound movement. A confirmed breakout, especially with volume, is required to validate further upside.
Outlook and risk levels
A clean move above 5,530 with momentum confirmation may invite a bullish continuation toward 5,720. On the downside, support at 5,300 must hold to preserve structure. A break below that would expose 5,165, with 4,934 acting as a critical downside threshold.
As outlined in our earlier analysis, the S&P 500’s rebound from the 4,900 region signaled technical buying interest. However, the current test of descending resistance and EMA clusters remains the deciding factor for near-term trend continuation.


