Microsoft rally lifts stock above 20-day and 50-day MA, eyes new monthly highs
 Microsoft share price rally shows shift in investor sentiment
Microsoft Corp's (MSFT) stock price closed last week on a strong bullish footing, recording an 8% weekly gain that saw the price break above key technical levels. The rally pushed the stock above both the 20-day moving average at $377 and the 50-day moving average at $388, confirming a clear sentiment shift from bearish to bullish.
Following last week’s breakout, Microsoft stock was little changed during Monday’s premarket session, trading near $391.35. The muted premarket movement reflected traders’ hesitation ahead of a busy corporate earnings week, as attention turns to broader market catalysts.
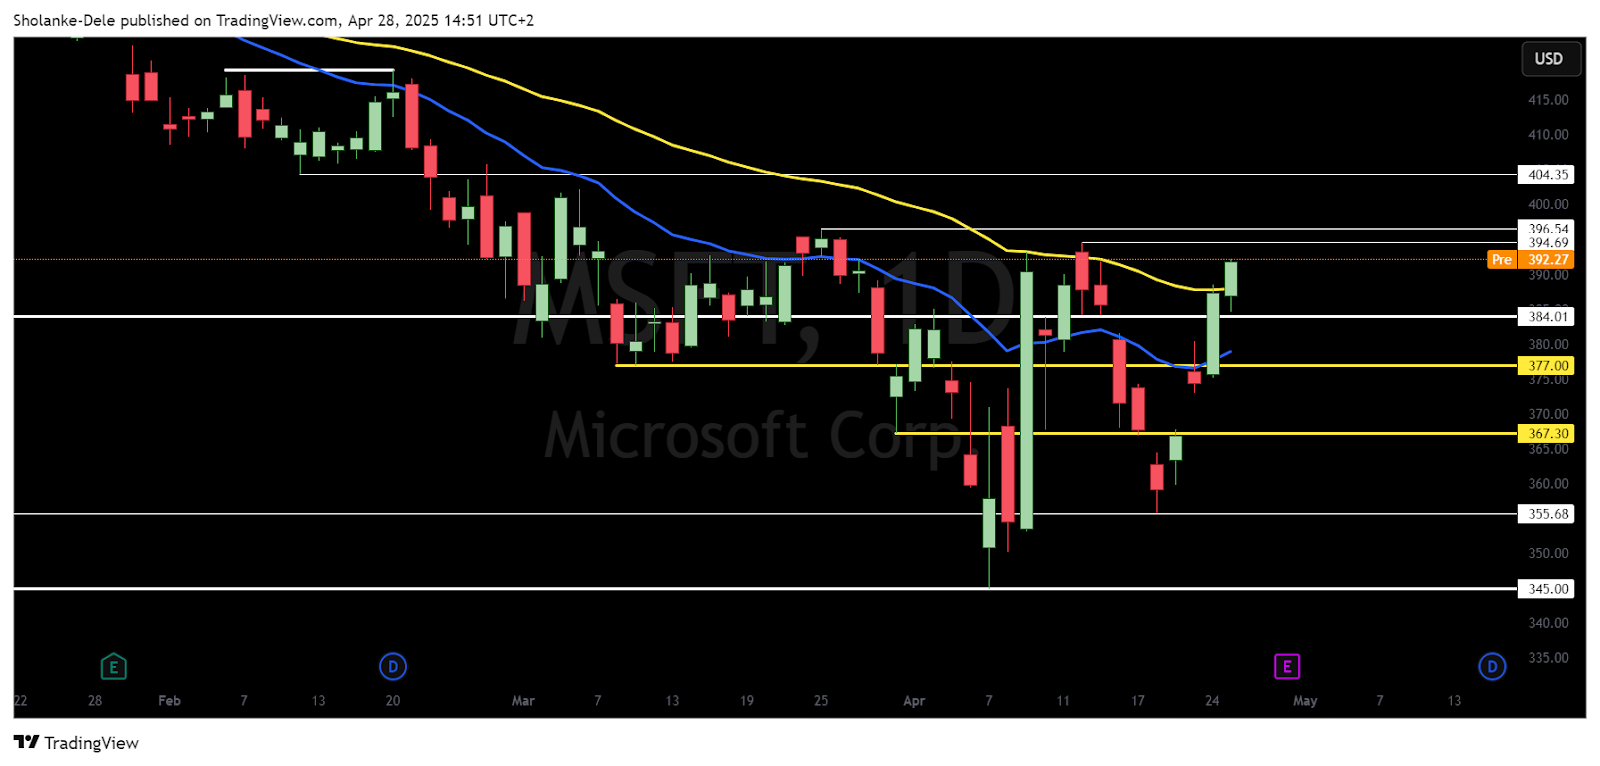
Microsoft price dynamics (Feb 2025 - April 2025). Source: TradingView
Technically, the stock now trades just 0.9% below the monthly peak of $394.9 and is also 1.3% away from retesting the $396.5 resistance level that capped price action in March. Short-term indicators, however, reflects that Microsoft’s recent rally has pushed the 1-hour RSI into overbought territory, highlighting the possibility of a near-term pullback from the current supply zone near $394.9.
Microsoft RSI readings suggest potential pullback but could be shallow
Despite the overbought signal on the 1-hour timeframe, broader technical indicators present a more bullish picture. The 4-hour RSI is hovering near the 60 mark, while the daily RSI sits in the mid-50s, suggesting that any pullbacks could be shallow and met with buying interest. This view is reinforced by the positioning of immediate support levels: the 50-day moving average at $388 stands as a nearby floor, followed by stronger support at $384 and then the 20-day moving average.
Looking ahead, price action around the $393.0 to $394.9 resistance zone will be a key target for Microsoft stock short term buyers. A sustained break above these levels could pave the way for Microsoft to set a new high for the month, while a failure to clear could trigger a challenge of the support levels.
Microsoft jumped 6.7% last week, breaking above the 20-day and $384 resistance levels. RSI turned bullish on daily and 4H charts, while the rally paused at the 50-day moving average.


