Intel stock price tests key resistance as technical signals hint at potential breakout setup
 Intel trades near $20.10 with potential upside toward $23.96 if it clears resistance with volume support
Intel Corporation (NASDAQ: INTC) is showing tentative signs of a base-building phase after rebounding from Q1 lows, but the stock remains confined within a broad downtrend structure. As of Thursday, INTC trades near $20.10, caught beneath a critical resistance zone between $21.00 and $21.50 that has historically rejected upward moves.
Weekly Fibonacci retracement levels mapped from the $27.55 swing high to the $18.41 low place the 38.2% retracement near $24.10—an area Intel has repeatedly failed to reclaim. This resistance confluence aligns with former distribution zones and a multi-quarter supply block.
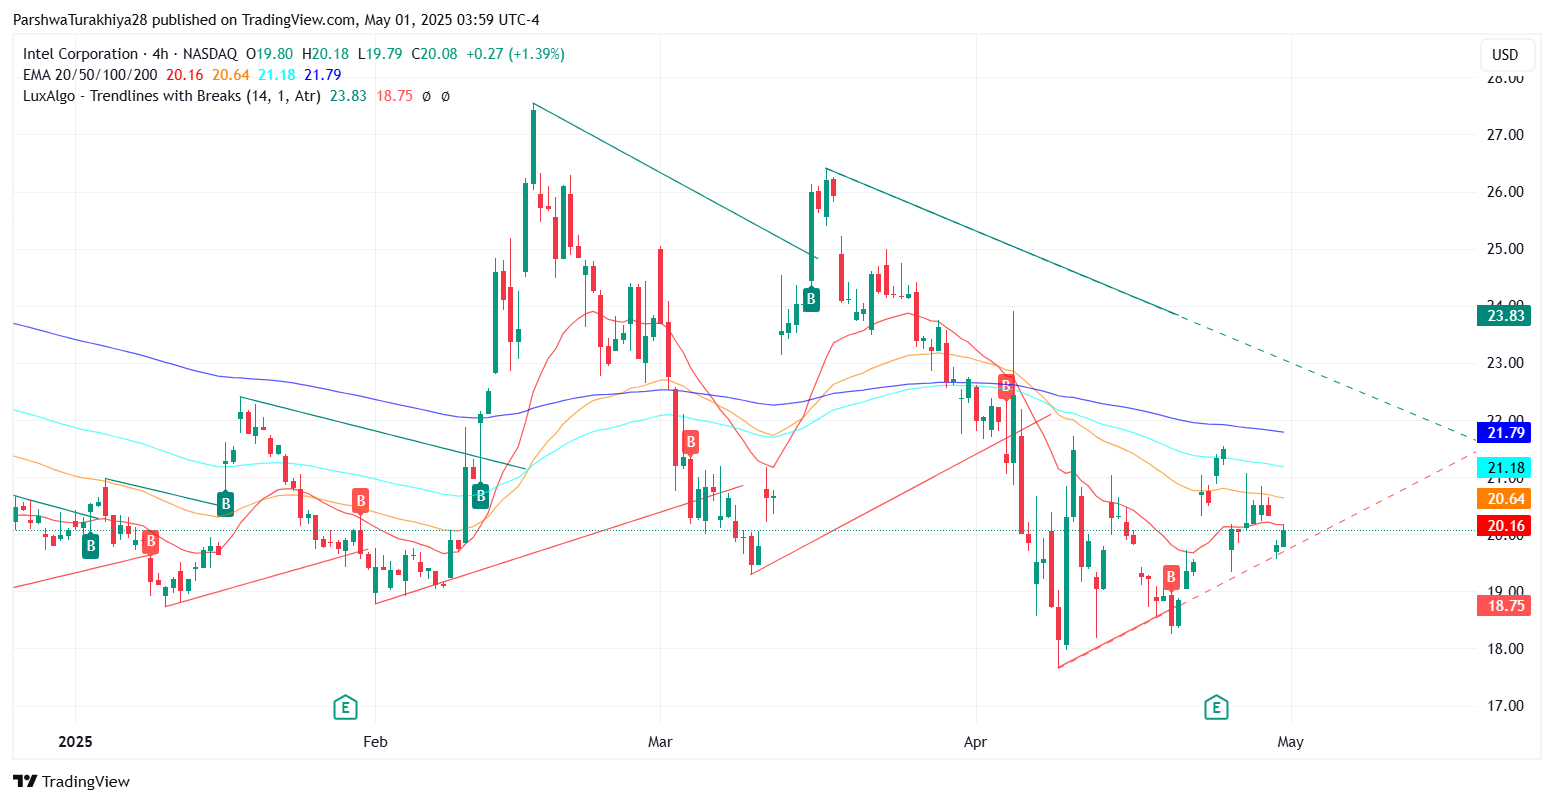
INTC stock price dynamics (January 2025 - May 2025) Source: TradingView.
Consolidation near EMAs as volatility compresses
On the 4-hour chart, Intel has reclaimed its 20-EMA ($20.16) and 50-EMA ($20.64), but both remain largely flat, signaling consolidation rather than breakout strength. Meanwhile, the 100-EMA ($21.18) and 200-EMA ($21.79) continue to hover overhead, reinforcing bearish pressure.
Momentum indicators reflect uncertainty: RSI has edged up to 48.66 but lacks bullish conviction, while the MACD is attempting a bullish crossover without solid follow-through. Price remains bound within a tight Bollinger Band squeeze, suggesting volatility expansion could soon follow.If bulls manage to propel INTC above $21.55 with volume confirmation, the next upside target rests near $23.96, corresponding to the 61.8% retracement zone. On the downside, a failure to hold above $19.50 could reignite bearish sentiment, potentially exposing Intel to a retest of $18.75 support and even the $12.92 Fibonacci extension if broader market risk-off sentiment deepens.
Pattern resolution underway as triangle breaks
Short-term charts offer a slightly more optimistic tone. Both the 30-minute and daily timeframes show Intel attempting to resolve a descending triangle, with price breaking above the $20.15 downtrend line and retesting it as support. If the breakout holds, momentum could carry INTC toward $22.10 and then $23.83, both of which sit at key supply and trendline resistance levels from the January 2025 highs. However, if sellers reclaim control and price dips back below $19.50, the failed breakout could accelerate downside pressure.
As previously discussed in earlier sessions, Intel was forming a potential bottom near the $18.30–$18.70 zone, where multiple demand tests occurred. This week’s price activity aligns with that outlook, but confirmation above the $21.50–$22.00 range remains vital to invalidate the broader bearish trend.


