S&P 500 index price nears key breakout zone as tech earnings and Fib levels align for bullish test
 S&P 500 consolidates below 5,600 as tech-led rally tests key Fibonacci resistance band
The S&P 500 Index surged on Thursday, buoyed by strong tech earnings and recovering sentiment, despite concerns over recent economic data. As of May 1, the benchmark index traded near 5,569, recapturing momentum after rebounding from April lows of 4,835.
The rally, which has now cleared the critical 5,500 mark, faces its next hurdle at a technical resistance zone between 5,583 and 5,600.
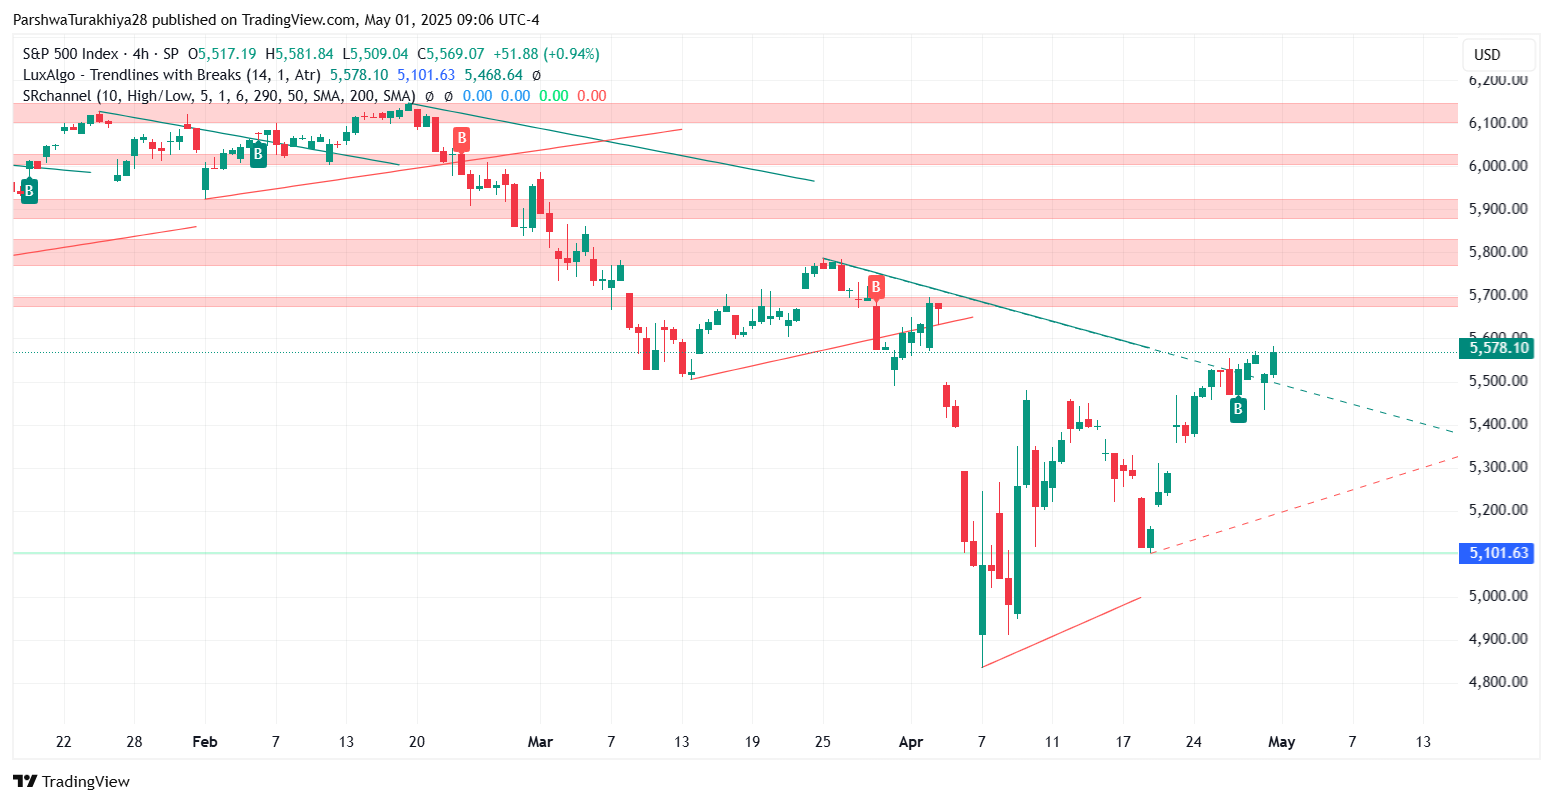
S&P 500 price dynamics (January 2025 - May 2025) Source: TradingView.
Tech earnings offset recessionary fears
Investor confidence was reinforced by better-than-expected quarterly results from Microsoft and Meta Platforms. Microsoft jumped over 7% in extended trading, driven by continued growth in its Azure cloud segment. Meta followed with a 6% rally after reporting strong revenue for the first quarter.
These results helped markets shake off recession worries triggered by a 0.3% contraction in U.S. GDP for Q1—marking the economy’s first decline since 2022. While the Dow and S&P 500 ended Wednesday higher, the Nasdaq remained slightly negative. Looking ahead, focus turns to earnings from Apple and Amazon, which could drive the next leg of price action.
Technical picture favors bullish continuation
From a technical standpoint, the S&P 500 is challenging a descending trendline near 5,578, with a potential breakout opening the path toward the March swing high of 5,787. Fibonacci retracement from the March high to the April low shows the index has surpassed the 0.618 level at 5,423 and is hovering near the 0.786 level at 5,583. A daily close above this point would confirm bullish continuation, with further targets at 5,786.95 and the 1.618 Fibonacci extension at 6,375.
Shorter-term momentum indicators are supportive. The 4-hour MACD shows a bullish crossover with widening histogram bars, and RSI stands at 60.35, just below overbought territory. All key EMAs on the 4-hour chart have aligned positively, suggesting upward trend strength. However, failure to clear 5,600 may trigger a pullback toward the 5,454–5,423 support zone.
As previously discussed, the S&P 500’s ability to hold above 5,423 and break through the 5,583–5,600 resistance is pivotal. A confirmed breakout could mark a shift toward a new bullish phase, while rejection at current levels may prolong consolidation. With key earnings and macro data ahead, traders should remain alert to high-volume reactions near trendline and Fib convergence.


