Apple price faces resistance at $212 as bulls attempt breakout from April rebound
 AAPL tests major trendline resistance near $212 as RSI cools off and EMAs compress
Apple Inc. (NASDAQ: AAPL) is trading near $205 after rebounding sharply from April’s $170 lows, with bulls now confronting a critical resistance cluster between $207 and $212. This zone coincides with a descending trendline from the February peak and has capped prior attempts at recovery since early March.
Price action is showing early signs of hesitation near this area, suggesting a potential inflection point.
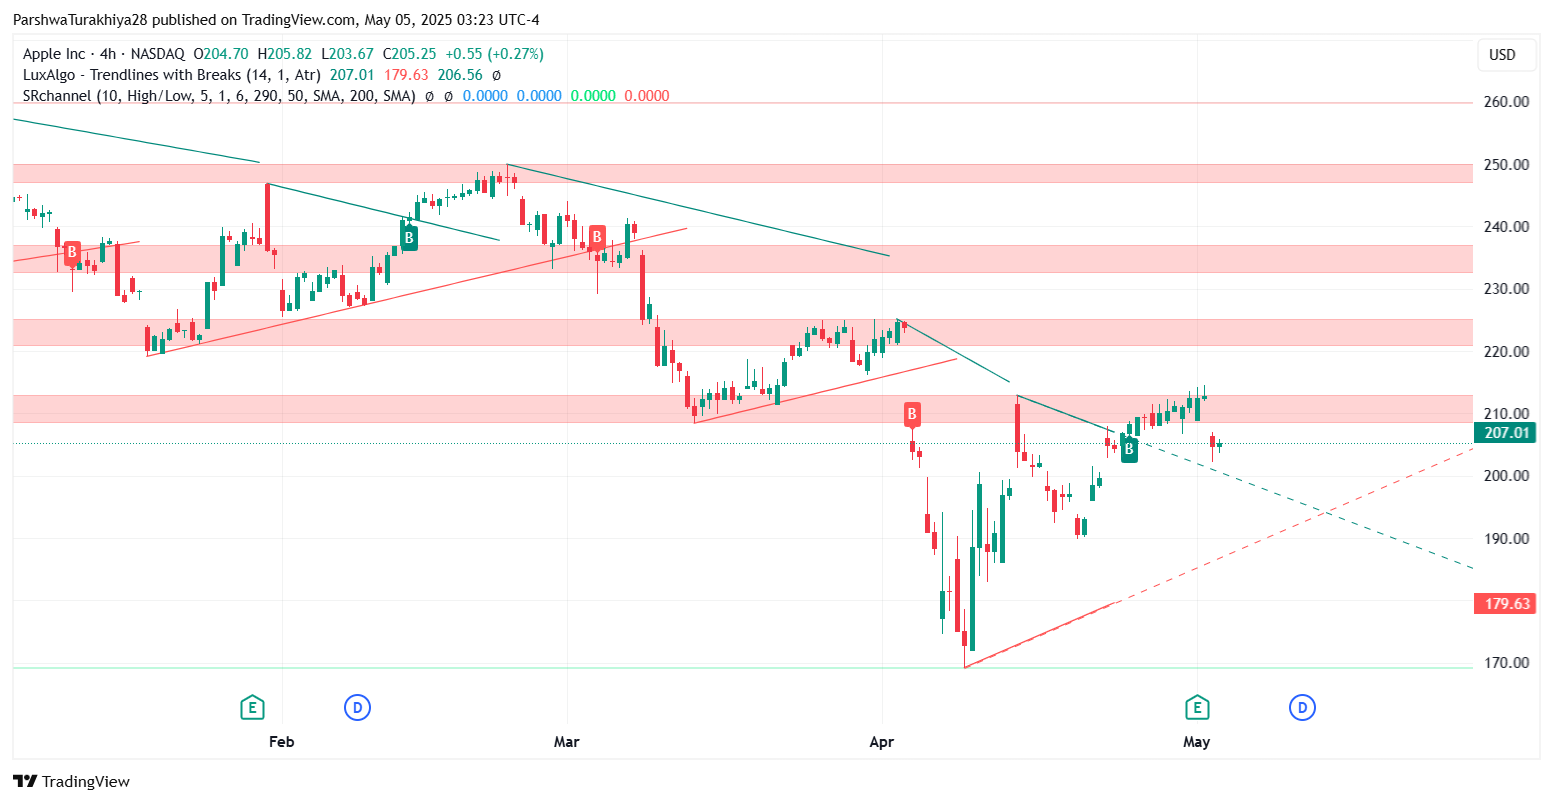
Apple price dynamics (January 2025 - May 2025) Source: TradingView.
Resistance band caps rally despite April strength
The daily structure shows price reacting to a supply zone between $207 and $212, which aligns with the underside of a key trendline that has been respected since Q1. Price briefly tested above this zone but failed to sustain the breakout, hinting at waning momentum. If bulls manage a confirmed close above $212, upside extension toward $220–$225 becomes likely. However, rejection here could send AAPL back to retest $200 and possibly $193, the lower end of the current range.
On the 4-hour chart, an ascending channel defines the recent recovery from the April low. Price is still trading within this structure, although the upper band rejection shows that bulls are losing strength near overhanging supply. A breakdown from this channel could expose the stock to a deeper retracement if $202–$200 fails to hold.
Momentum indicators flash indecision
AAPL is navigating a complex dynamic resistance cluster defined by the 50-, 100-, and 200-EMAs on the 4-hour chart. While the price is attempting to stay above the 100 EMA, the lack of alignment in the moving averages suggests the rally is corrective. RSI has slipped from near-overbought territory and now reads 48.65, signaling neutrality. Past turning points have occurred around RSI 40 and 60 zones, which may act as key pivots in the coming sessions.
The Ichimoku Cloud highlights further indecision. Price is clinging to the edge of the cloud base while the lagging span remains inside historical price congestion. The flat leading span suggests limited trend strength. A break below $202 would undercut bullish expectations and reintroduce downside risks toward the rising April trendline near $193.
As previously discussed in our April outlook, Apple’s rebound remains technically fragile. Without a clean break above $212, the rally may remain capped within a broader corrective structure. Momentum traders should monitor whether the $200–$202 support zone holds, as that will likely determine the next directional impulse for AAPL.


