GBP/USD price faces crucial support at $1.31 amid mixed UK employment data
 GBP/USD struggles at 1.31 as trade truce boosts dollar
GBP/USD has dropped to its lowest level since April 11, testing key support around $1.31. The pullback comes as the U.S. dollar strengthens after the announcement of a U.S.-China trade truce. The trade agreement, which involves significant tariff reductions by both the U.S. and China, has alleviated concerns about escalating trade tensions, giving the U.S. dollar a boost and pushing the U.S. dollar index (DXY) higher.
The U.S.-China trade deal has led to a reduction in tariffs, with the U.S. lowering tariffs on Chinese goods from 145% to 30% for 90 days, while China has reciprocated with a reduction from 125% to 10% on U.S. imports. This positive development has strengthened the U.S. dollar, as investors expect the deal to mitigate inflationary pressures in the U.S. and reduce trade-induced inflation risks. However, the strength of the dollar has exerted downward pressure on GBP/USD, which is struggling to hold onto gains amid the greenback’s dominance.
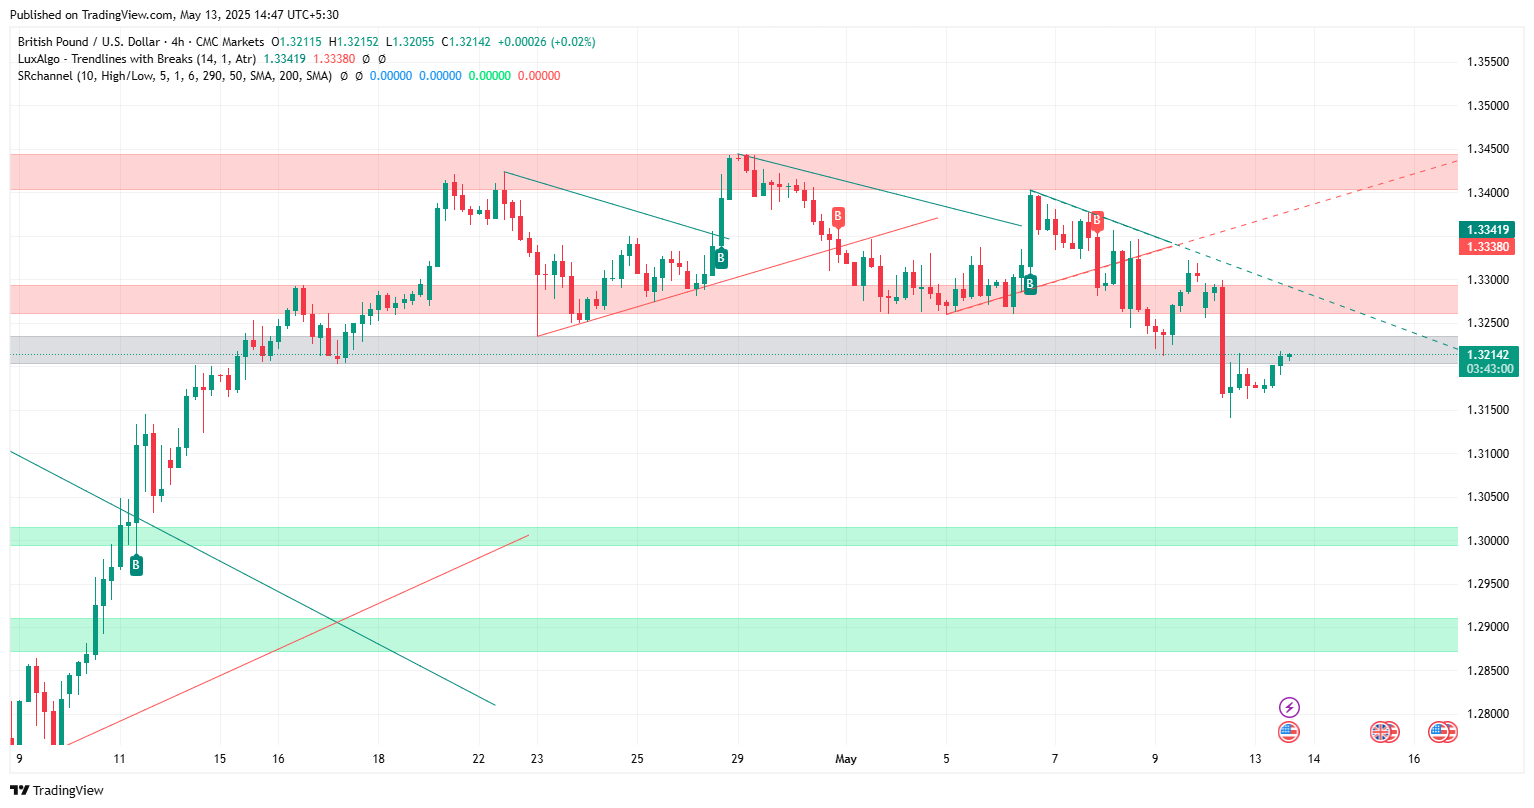
GBP/USD price dynamics (April 2025 - May 2025) Source: TradingView.
Mixed UK employment data and BoE policy outlook
The UK unemployment rate rose to 4.5% in the three months to March, slightly above market expectations, signaling some softness in the labor market. Jobless claims increased by 5.2K in April, a much smaller rise than the anticipated 22.3K. While wage inflation remains strong, with average earnings (excluding bonuses) increasing by 5.6%, this comes at a time when the UK faces uncertainty regarding its trade relations, particularly with the U.S..
The Bank of England (BoE) remains cautious about future monetary policy. While some members advocated for a 25 basis point rate cut, concerns over global trade tensions, particularly the U.S.-China trade war, continue to weigh on the UK economy. Unless economic conditions improve significantly, the BoE’s cautious stance is likely to keep the GBP under pressure.
Technical outlook: GBP/USD testing key support levels
On the 4-hour chart, GBP/USD has confirmed a bearish trend after breaking below the 1.34 resistance zone. The pair is now testing support at 1.31, a crucial level that has acted as both support and resistance in recent months. A failure to hold above 1.31 could lead to further declines toward 1.2900 or 1.2850, a key psychological level.
The Relative Strength Index (RSI) on the 30-minute chart is hovering between 55–60, indicating neutral to slightly bullish momentum. This suggests that while the current downtrend may be nearing exhaustion, any rally will need to overcome resistance around 1.3250 and 1.3296 to confirm a shift in momentum.
As mentioned in previous updates, GBP/USD has been in a consolidation phase, and the recent pullback near the $1.31 level has become a key support.


