Apple stock price tests key resistance levels after strong rebound from April lows
 Apple shares break above key resistance levels
Apple stock price tests key resistance levels after strong rebound from April lowsApple Inc. shares are trading around $212.30, gradually reclaiming key technical levels after a sustained rebound from April’s lows. The stock has managed to break above both the 20- and 50-period exponential moving averages (EMAs) on the 4-hour chart—critical levels that had previously capped several recovery attempts.
These EMAs, currently at $205.78 and $205.39 respectively, now act as immediate support. Additionally, the upper Bollinger Band on the 4-hour chart is expanding alongside the price, hinting at the possibility of a continued bullish momentum in the short term.
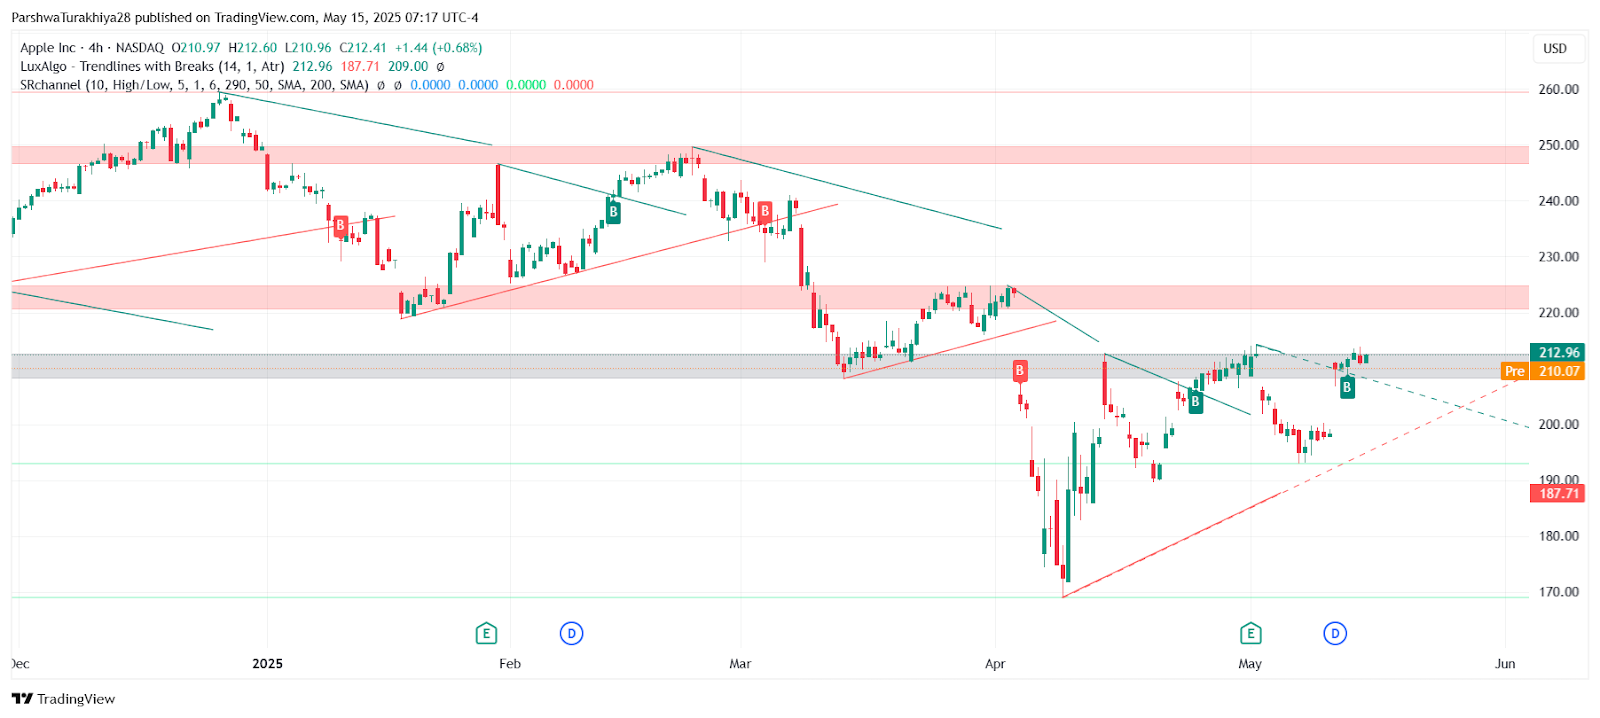
Apple stock price dynamics (December 2024 - May 2025) Source: TradingView.
Breakout above trendline resistance paves the way for higher targets
On a daily perspective, Apple has successfully cleared a descending trendline resistance that had been in place since the March high near $230. This breakout places the stock within a prior supply zone between $209 and $213. A close above this zone would mark the first clean breach since the April breakdown and could pave the way for a retest of the broader resistance range near $217–$224. This region aligns with the 100- and 200-period EMAs and remains a critical test for Apple’s longer-term direction. A sustained break above these levels could potentially drive the stock toward its 2023 highs, creating room for further gains.
RSI, MACD, and Fibonacci retracement levels suggest cautious optimism
Looking at momentum indicators, the Relative Strength Index (RSI) on the 30-minute and 4-hour charts sits just above 61, showing moderate bullish strength without entering overbought territory. Meanwhile, the MACD remains in a positive posture, though the histogram is narrowing, suggesting that momentum is stabilizing. If the MACD line continues to hold above the signal line, the bullish case remains intact for a push higher.
The broader Fibonacci retracement levels provide a critical perspective on the recovery. Apple has reclaimed the 0.382 level at $203.55 and is approaching the 0.5 retracement at $214.23, marking a critical inflection point. A sustained move above this level could signal further gains toward the 0.618 Fibonacci level at $224.91—a region that has previously acted as a resistance zone in late 2023.
Outlook and key levels to watch
For now, the short-term outlook remains cautiously bullish. A clean daily close above $213.50 would confirm strength and likely initiate follow-through toward $217 and $224. However, failure to hold above $205 could invalidate the current upward bias, with a potential pullback to retest $200 and possibly $195. The current price action suggests that Apple may be transitioning into a higher timeframe recovery phase, but confirmation through stronger volume and breakout follow-through will be crucial for broader conviction.
As previously discussed, Apple’s price action has shown a solid recovery from April lows, with the stock moving above key moving averages. The near-term direction will depend on its ability to hold above the $205 support region and break through the $213.50 resistance zone, which could trigger further upside momentum.


