Apple stock price faces resistance at $214 as bulls eye breakout
 Apple price consolidates under $214 resistance, with bulls eyeing $224
Apple’s stock is currently trading at $211.21, marking a significant recovery from its low of $169 in April. The recent price surge has been buoyed by a bullish breakout above a descending trendline resistance on both the 4-hour and daily charts.
However, the stock is now testing critical resistance just below the Fibonacci 0.5 retracement level at $214.23, creating a pivotal moment for bulls. A sustained move beyond this level could trigger a continuation of the rally toward $224.90.
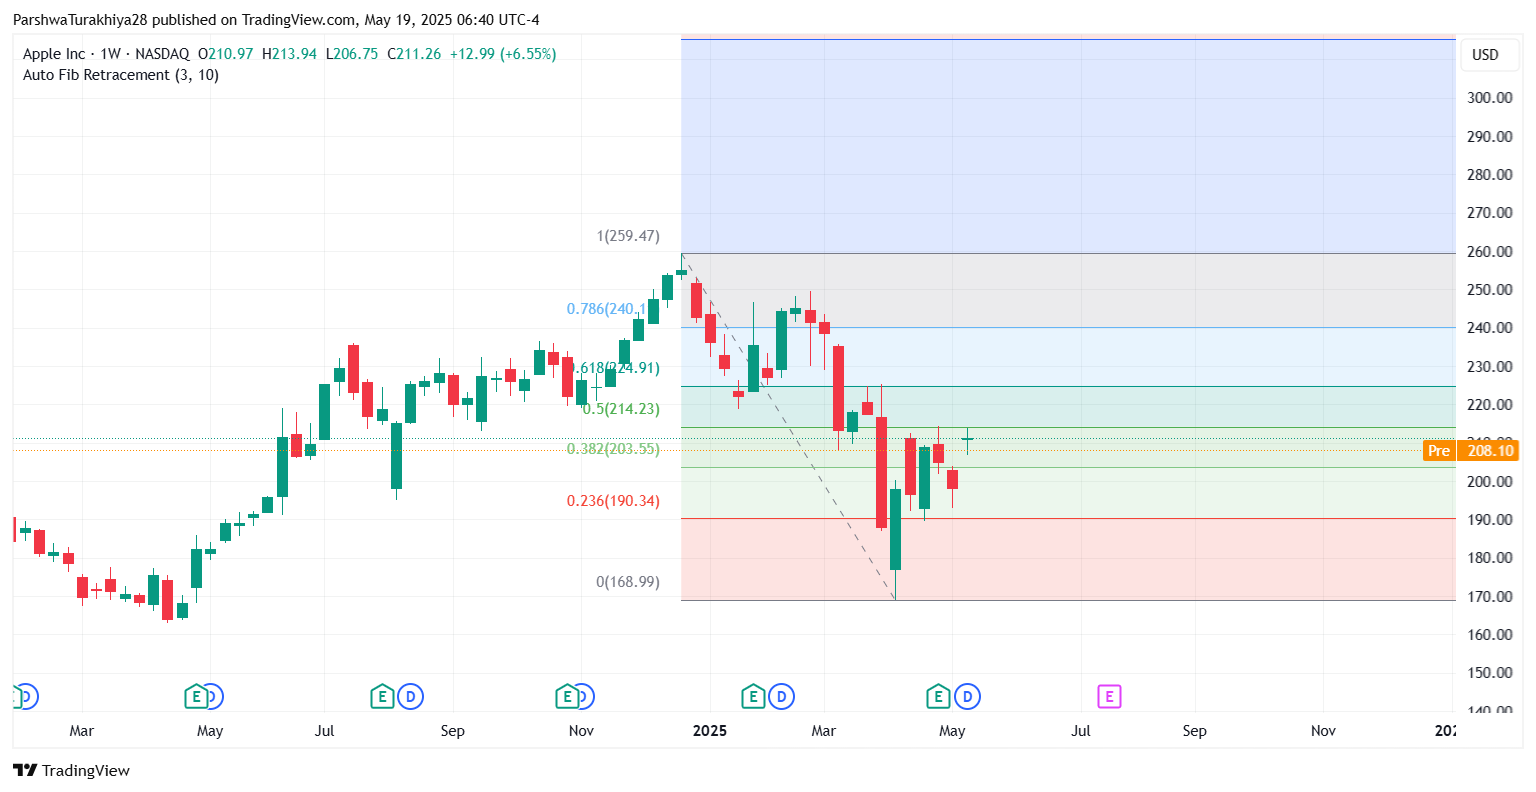
AAPL price dynamics (March 2024 - May 2025) Source: TradingView.
Resistance levels and short-term outlook for Apple
As Apple enters the week of May 20–21, its price action is showing signs of consolidation beneath the $214.23 resistance. The 30-minute and 4-hour charts indicate a breakout and retest of a descending wedge, with support forming in the $208–$210 zone. This price range is reinforced by the 20/50/100/200 EMAs, which are also compressing near $206–$210, making it a crucial demand zone in the short term.
The relative strength index (RSI) on the 30-minute chart hovers around 50.6, reflecting neutral momentum. Meanwhile, the MACD remains flat, positioned just above the signal line, indicating limited downside unless there’s a break below $208. In addition, the Bollinger Bands are narrowing on the 4-hour chart, hinting at potential volatility expansion and a possible breakout.
Short-term price action and key levels to watch
Looking ahead to May 20, Apple’s stock could remain range bound between $208 and $214 as it consolidates near resistance. A decisive close above $214.25 would trigger bullish momentum, opening the door to a move toward the next key target at $224.90. Conversely, a failure to break through the $214 ceiling could lead to a retest of the $208–$210 zone, which continues to act as short-term support.
As previously discussed, Apple’s stock remains technically poised for a breakout, with critical levels at $214 and $220 to watch. A breakout above $214 could accelerate the rally toward the next Fibonacci target at $224.90. If the bulls fail to hold above $208, however, a pullback toward the $203.50 support zone could be in the cards.


