Alphabet stock RSI and EMA crossover align to keep bulls in control amid premarket dip
 Monday’s premarket trade has seen the stock down 1.7%
Alphabet’s Class A shares (GOOGL) are entering the new week in a short-term pullback phase following a strong 7.7% rally last week.
That move, which saw the stock break above its 20-day and 50-day EMAs, peaked at $169.50 before facing a supply resistance zone and retreating slightly to close the week at $166.10.
Monday’s premarket trade has seen the stock down 1.7%, trading around $163.30. Despite the drop, price is approaching a critical support area near $161.50 — a level aligned closely with the 50-day EMA. This cluster of technical support could play a key role in halting the current pullback and setting up a fresh bullish leg.
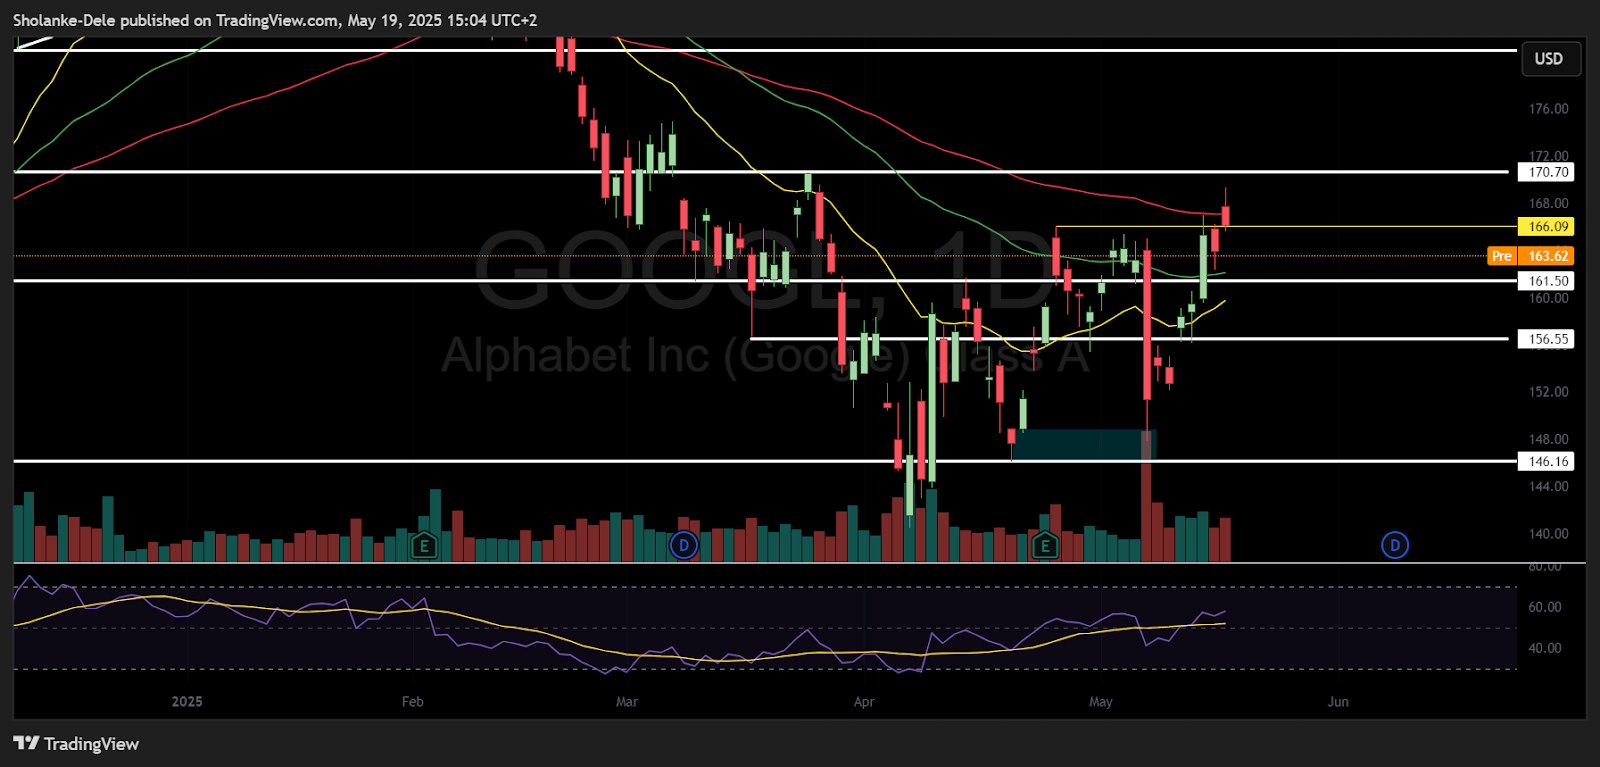
GOOGL stock price dynamic (Jan - May 2025). Source: TradingView
Short-term momentum remains constructive. On the 4-hour chart, a bullish crossover, often referred to as a golden cross has formed between the 20 and 50 EMAs. This crossover, coupled with a 4-hour RSI near 62 and daily RSI around 57, suggests underlying bullish momentum has not been fully lost. As long as price holds above $161.50, GOOGL could bounce and retest last week’s closing price at $166.10.
GOOGL stock inefficient zone could slow down recovery attempts
A break above that level would place the previous week's high of $169.50 back in focus. This price area acted as strong resistance last week and now forms the first upside objective. Should bulls push above $169.50, the next near-term target lies at $170.70, where a notable resistance zone could test buying appetite.
However, the downside scenario should not be dismissed. A deeper retracement would expose the price inefficiency zone between $162.40 and $160.60. This zone could attract sell-side activity while offering opportunities for price rebalancing. A break below the 20-day EMA, now hovering around $159.80, would invalidate the short-term bullish bias and suggest a broader pullback could be underway.
For now, price action suggests GOOGL is at a crossroads. Key moving averages and RSI levels are still aligned in bullish territory, but the test of immediate support will determine whether the stock continues its upward trajectory or corrects further into lower technical zones.
Alphabet stock recovered from last week’s AI-driven selloff and broke above its April high. The price flipped bullish as it cleared the 50-day EMA and RSI turned upward.


