GBP/USD price faces key technical levels as traders eye breakout or breakdown
 GBP/USD faces critical technical levels, with traders watching for a breakout or breakdown
The GBP/USD pair is trading at 1.3342, showing a slight pullback after a rejection at the 1.3390 intraday high. Despite recent bullish momentum, the pair has broken below a minor ascending trendline on the 30-minute chart, indicating a near-term weakening bias. The price action remains confined within a key demand zone around 1.3340, which aligns with the lower boundary of a short-term horizontal consolidation range.
Highlights
- GBP/USD faces support at 1.3340, with resistance at 1.3390 limiting upside.
- Short-term technical indicators show early signs of weakness, with momentum turning bearish.
- A breakout above 1.3390 could target 1.3428, while a breakdown below 1.33 could lead to further declines.
The GBP/USD price action is currently testing critical support and resistance levels, and the market is waiting for a clear catalyst. Traders are closely watching for signs of a breakout above 1.3390 or a potential breakdown below 1.33. A decisive move in either direction could set the tone for the near-term outlook.
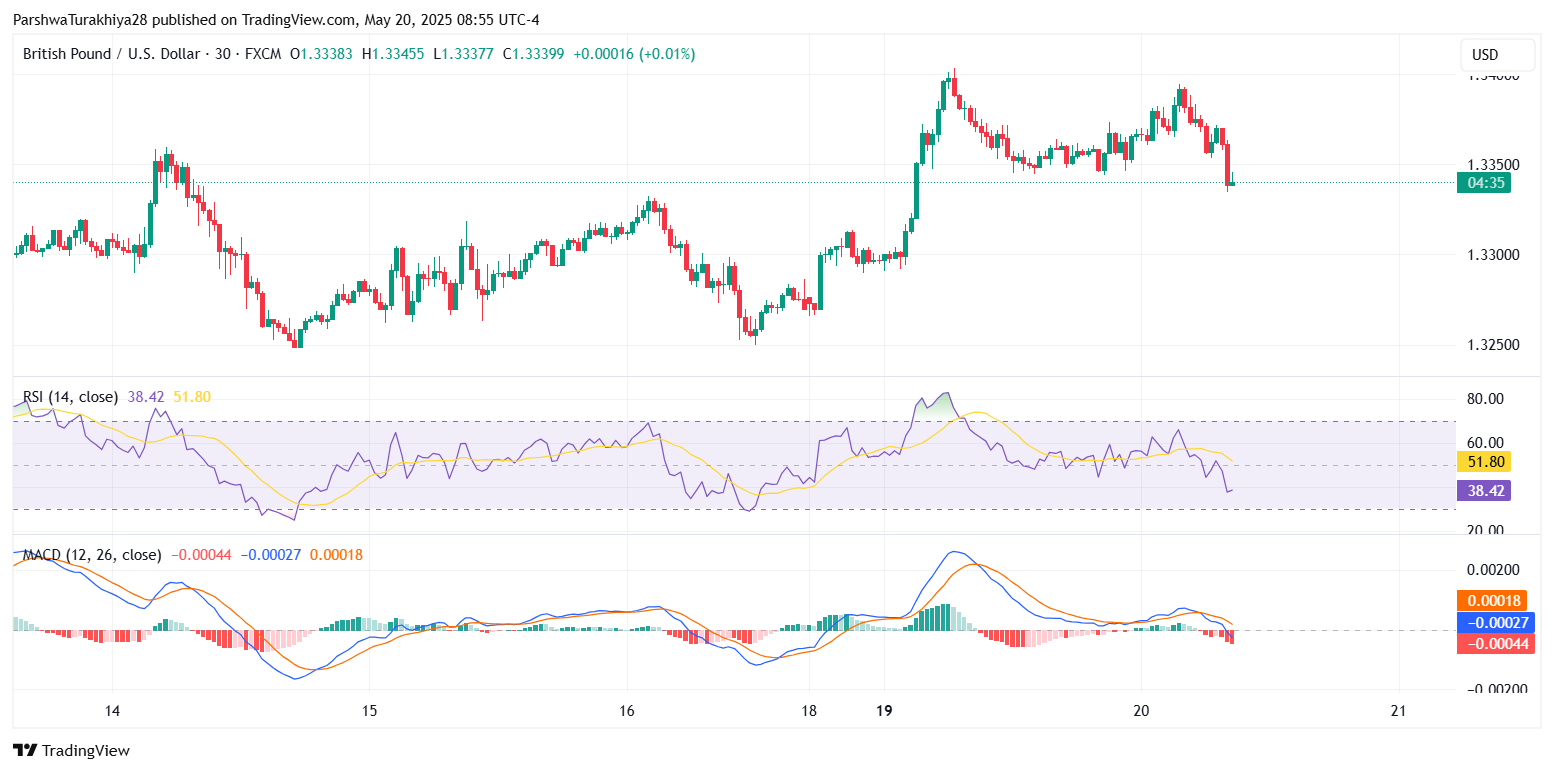
GBP/USD price dynamics (May 2025) Source: TradingView.
Bollinger Bands and moving averages suggest cautious consolidation
On the 4-hour chart, Bollinger Bands are tightening, with the price oscillating between the middle band (20-SMA) at 1.3327 and the upper band at 1.3391. This squeeze pattern implies that volatility may increase soon, with traders watching for a clear breakout. The EMA 20/50/100/200 cluster between 1.3306 and 1.3212 is sloping upward, confirming that the medium-term trend remains bullish. However, for this bullish structure to remain intact, the pair must hold above the 1.3320–1.33 zone to avoid a deeper pullback.
Momentum indicators turn bearish on lower timeframes
The 30-minute RSI has dipped below the neutral 50 level to 39.10, indicating weakening buying pressure. The MACD is showing a bearish crossover with the histogram turning negative, reflecting intraday weakness. A confirmed break below 1.3330 could expose the pair to support at 1.3300 and 1.3287, with further downside risk to 1.3250. Conversely, a rebound from support could allow the pair to test resistance at 1.3390 again, potentially opening the door to 1.3428.
Short-term outlook for May 20–21
Looking ahead, the short-term outlook for GBP/USD hinges on the price’s ability to hold above key support levels. If the 1.3320–1.3300 range holds, a rebound toward 1.3390 and 1.3428 is possible. A break below 1.3300, however, could signal further weakness, targeting 1.3287 and 1.3250 as potential downside targets.
As previously discussed, the GBP/USD price remains in a narrow consolidation zone with key levels at 1.3300 and 1.3390. The pair's performance over the next few days is likely to depend on a decisive break above or below these levels. Traders should remain vigilant for any signs of a breakout, as this could lead to a test of higher resistance zones near 1.3428 or a deeper pullback toward support at 1.3287.


